This article continues the key discussion of currencies. Here is a link to Part 1: The $USD.
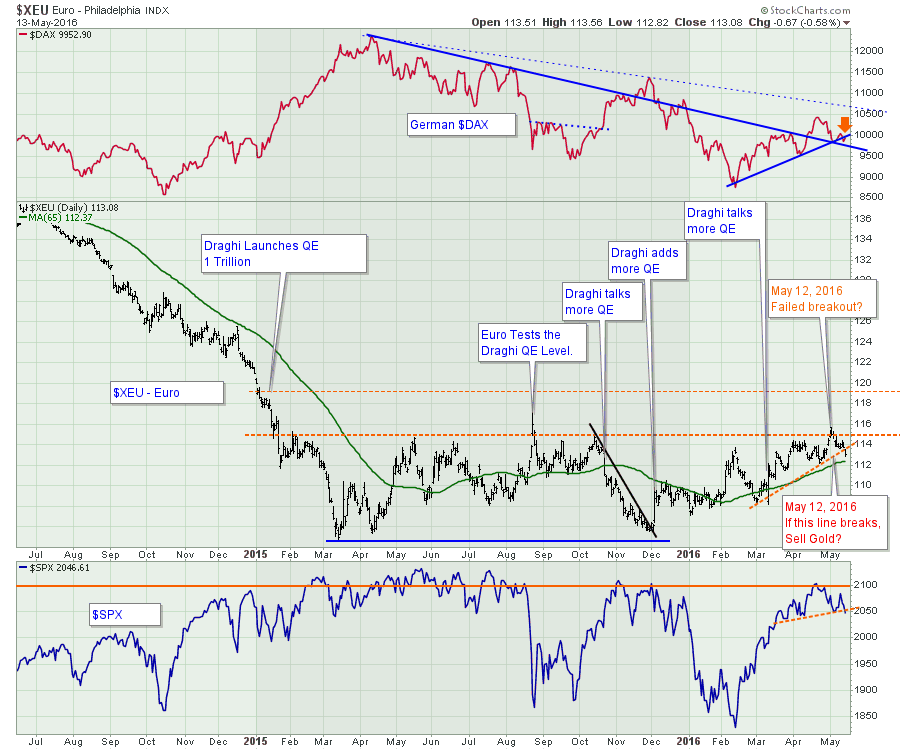
The Euro. Here is the short view. The major point is that this appears to have been rejected at the 115 level one more time. The spike in August 2015 was the highest intraday high. One of the major points about this chart is the breaking of the $DAX, the $XEU and the $SPX trendlines.
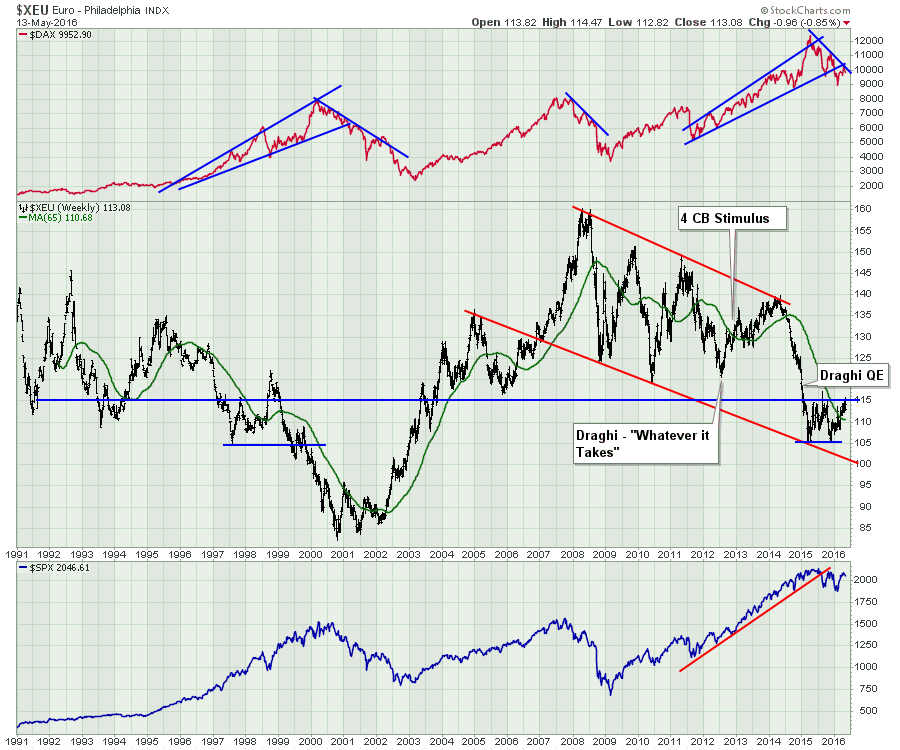
Widening out the chart, we can see the Euro's complete history. I think the big picture is the continuous downtrend since the financial crisis. Two interesting patterns on the chart are the two major trumpets on the $DAX chart shown in blue. Now that the $DAX, Europe's strongest economy, has broken out of the pattern, this looks like a replay of that situation. We can also see the consolidation pattern in the Euro ($XEU) in 1997 and 1998. The big move down in the Euro started around the 135 level back in 1995. The current drop started around 140. I am interested in the Euro bottom marking a major trend change. So far that does not seem to be happening, as the current range in the Euro has been unable to stop the slide in the $DAX.
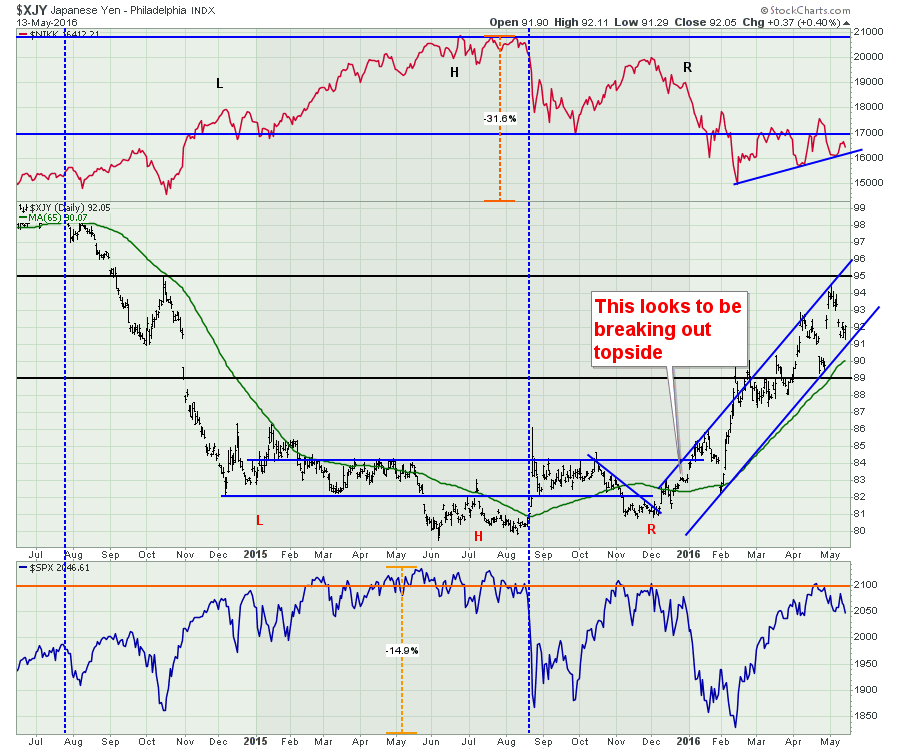
 When we look at the Yen, we see a much more interesting chart. The Yen, unlike the Euro, has broken out of the base. As the Yen approaches the horizontal level of 95, this could be very important. While the Yen has rallied, the Nikkei has just moved sideways, oscillating around 17000. But the volatility on the $Nikkei is almost double the volatility on the $SPX. In the centre of the chart, I have used some percentage scales to show the change in the Nikkei (31%) compared to the $SPX (14.9%).
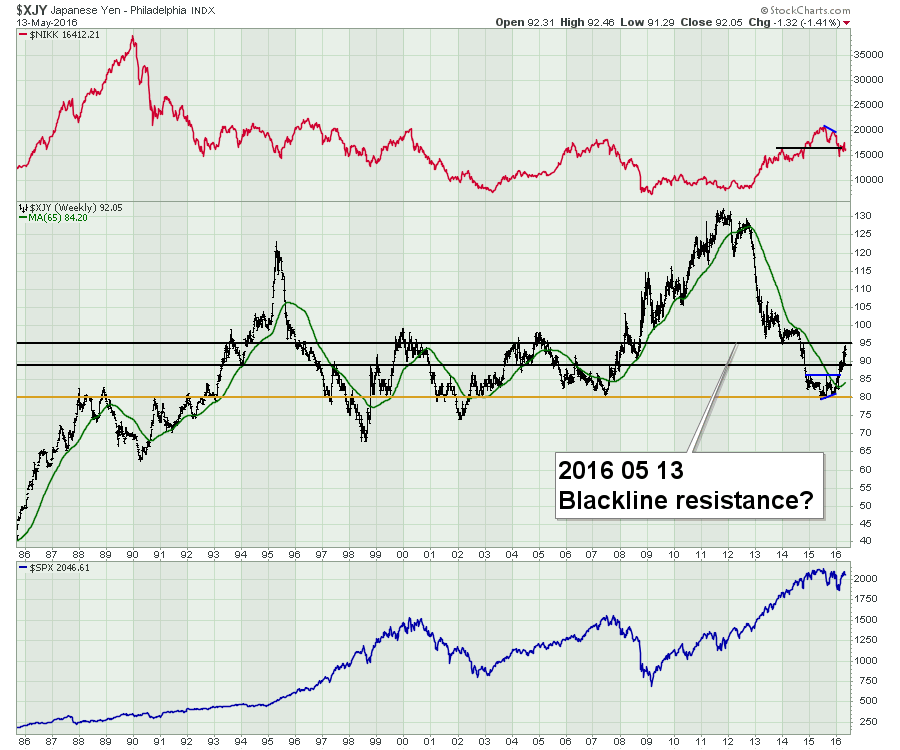
 Here we are on the wide version of the Yen. The Yen has stalled at this level many times before. Much like the US Dollar, it is not necessarily the direction of the Yen, but the change in trend that is usually a clue for the equity markets. I heard both Honda and Toyota announced poor results in the last few days. The steepness of the recent rise is very concerning. With the Nikkei already off 30% from its highs in February, any new bearish signals would be extremely problematic. A rising Yen is difficult for Japanese exports.
 To summarize, both the Euro and the Yen appear trapped below long term resistance. That is bullish for the $USD.
In Part 3, I'll cover the commodity currencies.
In case you missed the Commodity Countdown Webinar 2016-05-12 that led to this series of articles, click on the link. I have a presentation to the Vancouver Chapter of the CSTA on May 18th, 2016. If you are interested, click here. Victoria/Vancouver meeting 2016-10-18. You can also follow me on twitter @Schnellinvestor. Sometimes email is the best way to receive these articles. Feel free to click on the Yes button to get this blog direct into your email when new articles arrive. You can check out The Canadian Technician 2016-05-17 Webinar by clicking on the link to register! We can definitely cover off more ideas about this currency situation. As always, feel free to share articles with family and friends who might be interested.
Good trading,
Greg Schnell, CMT, MFTA
