On the Commodities Countdown Webinar, I implied that there were lots of interesting currency setups currently and I would try to write an article about them this weekend. Here is the first article in that effort.
Currencies occasionally help to spot changes in market sentiment or weighting of international/domestic for equities traders. While the correlation of the $USD to the $SPX is hardly a reliable trade signal, the changes in trend can be timely with the equity markets on occasion. When they all look ripe for some signal, that can be important. If nothing else, be alert for potential trend changes when the currencies are changing their trends.
When currencies trade towards support and resistance levels, signals are given out depending on the result. Below, I've captured some of the important levels for the Dollar that are generating curiosity for me.
The US Dollar ($USD)
Back in January, we were discussing the $USD's inability to break through 100. The stock market had just been thru a significant month long decline to start the trading year. As the dollar stalled, and the trend lines started to snap, many of the commodities like oil, gold, silver, copper, and steel all made significant rallies.
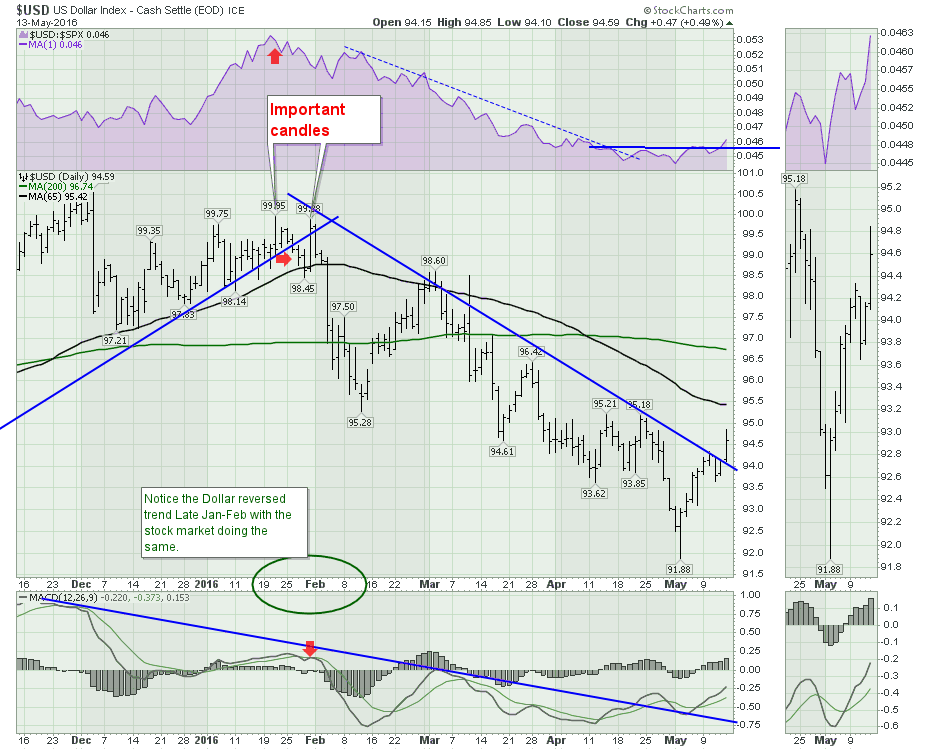
On Friday the 13th of May, we have the first close above the trend line since the market lows. Note that the trend line is using end-of-day (EOD) closes rather than intraday highs. While the trendline is not tight fitting, it does represent the trend. The Dollar trades around the clock so end-of-day is not as important but it is the end of live equity markets so there is still value on the close at that time. Looking at the purple relative strength (RS) in the top box, there appears to be a trend change there as well. The RS is making new one-month highs for the first time in months. After stabbing down to 91.88 on May 3rd, the dollar has made a progressive move higher, moving up 2.97 in two weeks from low to Friday's high.
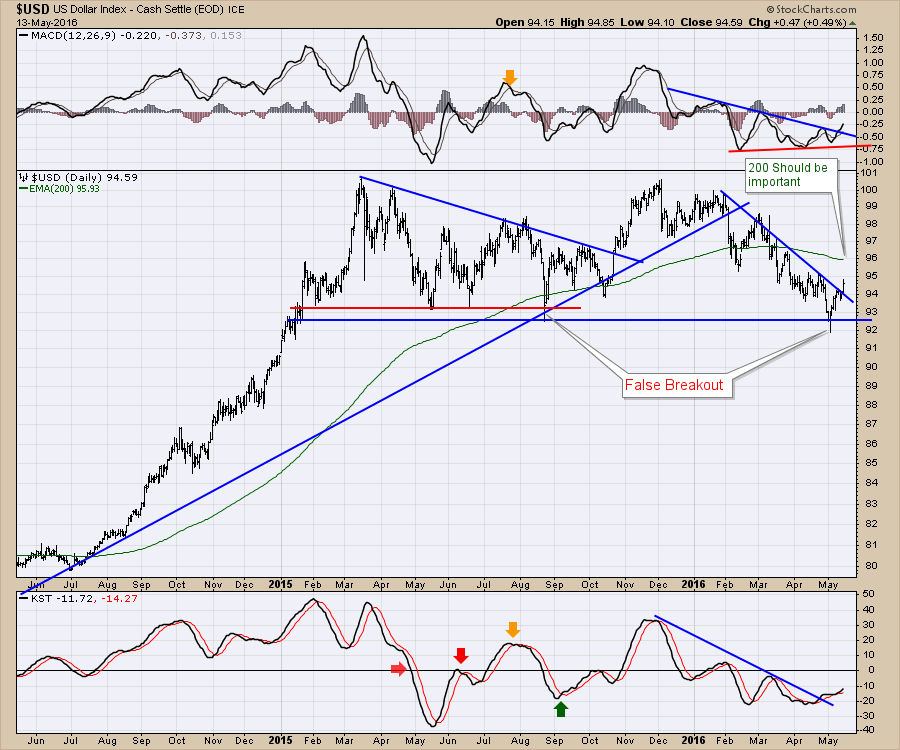
Zooming out on the $USD, we can see we had a false breakout on May 3rd. This 16-month consolidation has been wide-ranging with multiple trips between the extremes. Whether you use the KST or the MACD, both have broken downtrends.
Lastly, for the $USD, let's look at the big picture. This is a 30-year chart of the dollar. I started building the chart, then recognized some patterns going on within. Let me roll through them one at a time.
1) Breaking through 10-year trendlines.
In 1997, we broke out from a 10-year trendline which I have marked with a yellow dotted line. Recently, we also broke out from a similar 10-year trendline.
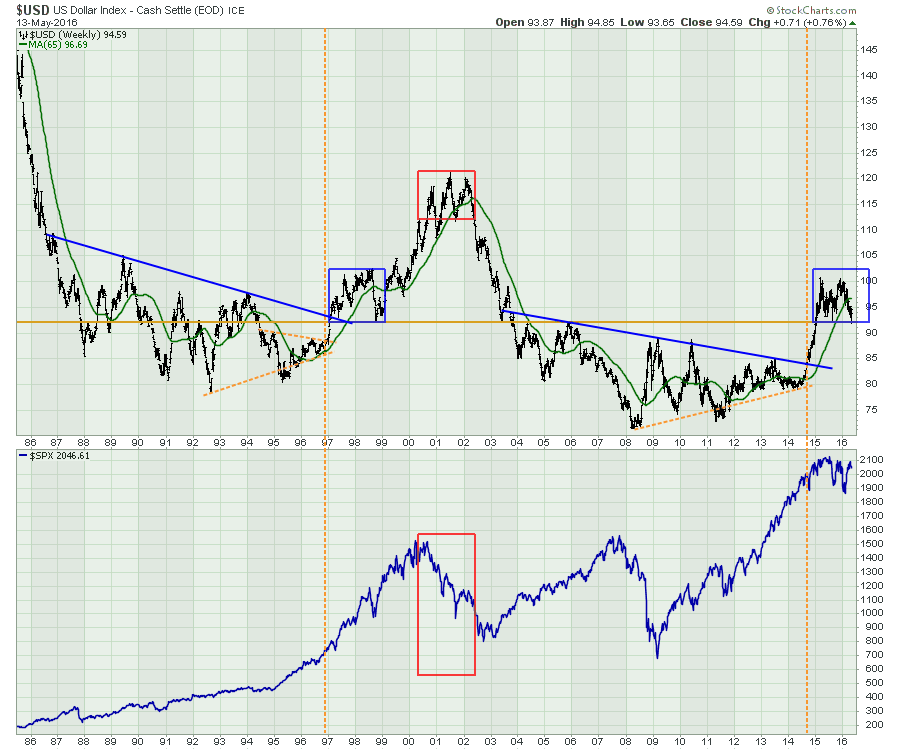 Older investors will remember the 1995-2000 period as the tech boom. Everyone was investing in North American tech stocks (Sony and Nokia as well). The global equity markets surged in a big way with the dollar. Moving to the 2014 dotted line, which marks the breakout above the blue 10-year trend, we see the markets have responded differently. The equity markets were surging till the $SPX got to the price level 2000 in 2014. Since then we have been in a 15 month sideways trading range. Whether you use the end of QE Infinity in 2014 or the breakdown in oil, it was a major change in the equity market trend shown on the $SPX.
2) A Period of Consolidation
Shortly after the breakout above the blue 10-year trend, the dollar went into a 15-month consolidation in 1997-1999. The most interesting comparison to today is the similarity of the two blue boxes both starting shortly after the major breakout above the 10-year range. As the US dollar continued to drive higher in 1999-2000, the stock market rolled over and topped out. In what could only be described as a vicious move, the dollar soared another 30 points (1999-2002) from the gold line at 92. Even the 65 week MA trend (green moving average) looks similar currently. I have shown the duplicate chart below to control the amount of scrolling for you. Probably the single biggest thing we need to watch for here is how the dollar moves from here. Does it do a repeat and surge another 30 points, or does it break down?
 3) The level of 92.
- Since 1997, this 92 level has been a major fulcrum for the US dollar.
- It marked the breakout level above the blue downtrend in 1997.
- It also marked the dollar returning to support in 1999.
- In 1997, it clearly delineated a major change by breaking out to 3-year highs above the orange dotted line.
- While the stock market soared on the advent of the tech boom, it also retraced almost the entire move, until the dollar got back below 92.
- The resistance at the peaks including 2004, 2006.
- The resistance level at 92 came somewhat into play for the peaks in the 2009 financial crisis and 2010. ~3 Points.
- The 92 level has now marked the base for the current consolidation.
To conclude, the US Dollar continues to behave similarly to the 1997 trendline breakout. This consolidation is an important step. The 92 level is extremely important to the dollar.
I also think there is one more chart for the $USD that is important. Comparing $USD to Crude Oil ($WTIC).
Notice Crude oil's behavior during both blue box periods. In the 1997-1999 period, crude oil fell 60%. From 2014-2016, crude fell 75%. In both cases, while the dollar consolidated after breaking out from major trendlines, crude oil melted down. While that was a sideways move in the dollar, the red box shows something totally different. In the red shaded box, notice that the final high in the dollar in 2002 marked the start of the surge in the price of oil. As the dollar fell, the oil price soared.
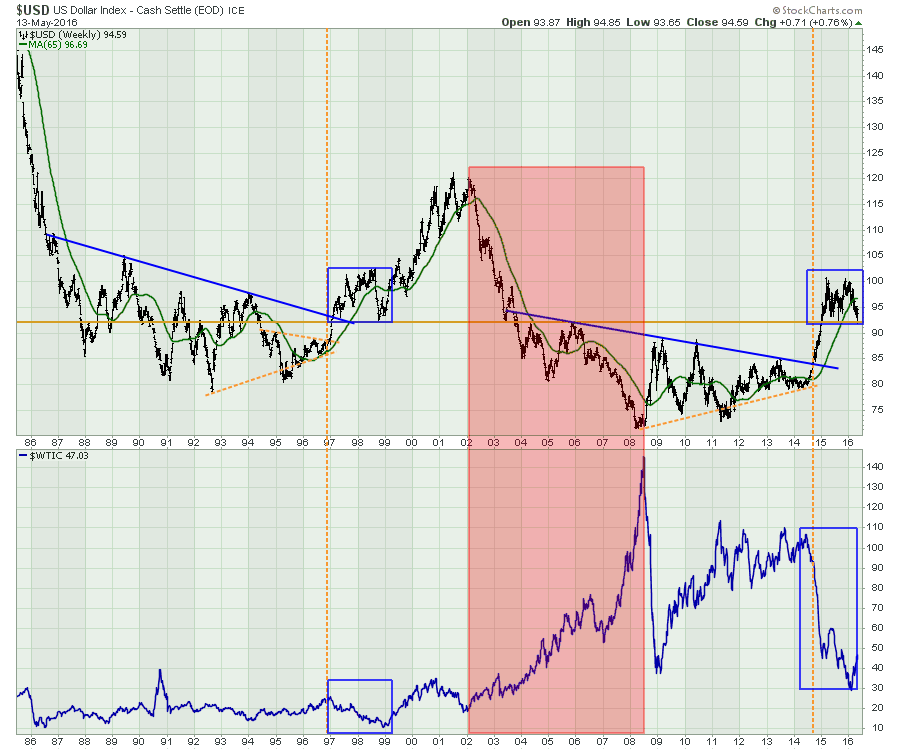 While this red shaded area seems obvious, I don't think one would have associated a 2-year skid in the price of oil in 1997-1999 and 2014-2016 with a consolidating dollar. Another significant point of information on the chart is that oil rose throughout the period of 1999-2001 while the dollar soared. It would suggest being very cautious about shorting oil, even if the dollar rises. What was also notable in 1999, was the move in crude went on a straight surge after the lows, to 9-year highs and topped with the first peak as the start of the head/shoulder top between 2000-2002. My takeaway is the fact that after this massive decline in crude, don't be surprised to see it rally, even in the face of a rising dollar.
I think the study of the dollar is enough at this point.
To conclude:
- 92 is an important support level in $USD.
- The matching patterns on the long term charts are compelling.
- We could see a rise in the $USD and not have a fall in oil.
- We might only be part-way of the final move in the dollar if the long term pattern replicates.
- Sometimes a top in the dollar marks a bottom in equities, sometimes they top together.
- Sometimes a bottom in the dollar marks a top in equities, sometimes they bottom together.
- It's more about the reversal of an existing currency trend that seems to coincide with major changes in the equity markets. The direction might not be the clue.
In case you missed the Commodity Countdown Webinar 2016-05-12 that led to this article, click on the link. I will be presenting to the Vancouver Chapter on May 18th, 2016. If you are interested, click here. Victoria/Vancouver meeting 2016-10-18. You can also follow me on twitter @Schnellinvestor. Sometimes email is the best way to receive these articles. Feel free to click on the Yes button to get this blog direct into your email when new articles arrive. I will also be doing The Canadian Technician 2016-05-17 Webinar so click on the link to register! I will definitely cover off more ideas about the currency situation. In the next article, I'll roll through the Euro and Yen. As always, feel free to share articles with family and friends who might be interested.
Good trading,
Greg Schnell, CMT, MFTA
