Recently, the market has experienced a Trump Jump on the back of the overnight lows on election day. Surging forward, anyone who had either pulled back from the market or was caught watching and waiting has seen the $INDU chart up 5 days in a row since the election. But there is more. It seems regardless of the space, some of the moves have been parabolic. For some reason, the airlines have suddenly taken off in time for Thanksgiving. Marijuana legalization was on some of the voter ballots. Canopy Growth Corporation, a legal marijuana growing entity in Canada, has gone ballistic. Manulife Financial, a large Canadian insurer that wandered sideways to down for a couple of years, has gone vertical, and in the bottom right, Hudbay Minerals has gone parabolic.
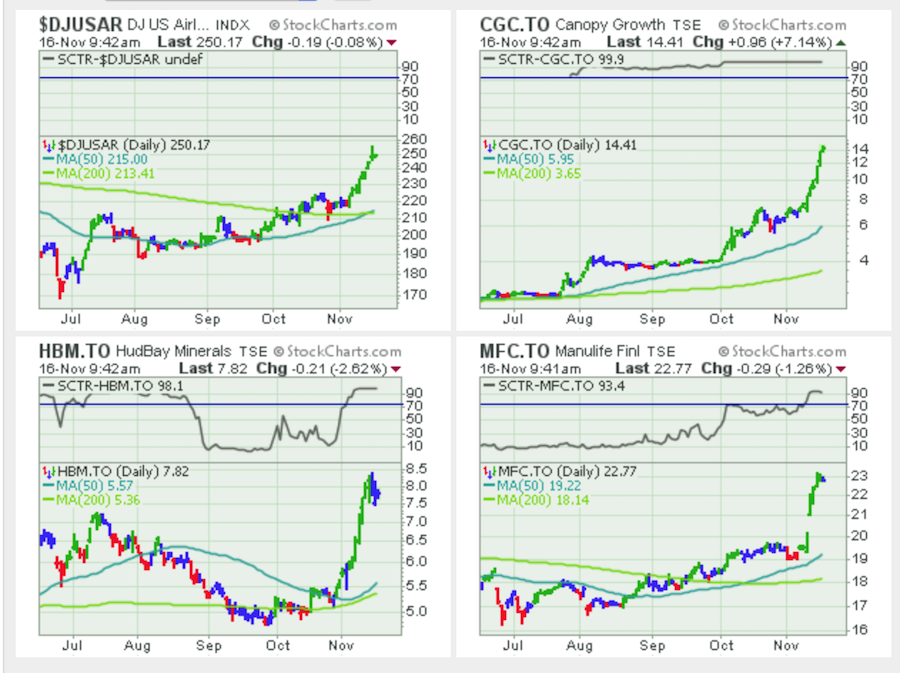
While each stock has a story, the reasons are vastly diverse for each one of these going straight up. So the point of this article is that there are profitable trades being made across the spectrum of stocks while the index for the Canadian market is sideways.
Breaking the market into different themes can be helpful. Currently, the US Dollar going higher is a big theme. A rising US Dollar hurts Gold usually so precious metals might best be avoided in that scenario. As well, crude oil has been pulling back, helping transportation stocks. The marijuana movement is early in its infancy so that could be a theme. The removal of some of the banking regulations could help the financial stocks as examples of theme investing. Cybersecurity is also a broad theme.
Within each one of these themes, the market accelerates like a raging bull into them. Then after some serious gains have been made, they roll back and fall out of favour. Trying to stay on top of all of these swings is the technicians role. A fundamental investor might use the themes, but they don't have a strong method for helping with timing the entries and exits if they do not use technicals. Technicals are also called behavioural finance. Understanding what investors are doing with a stock is just as important as the theme.
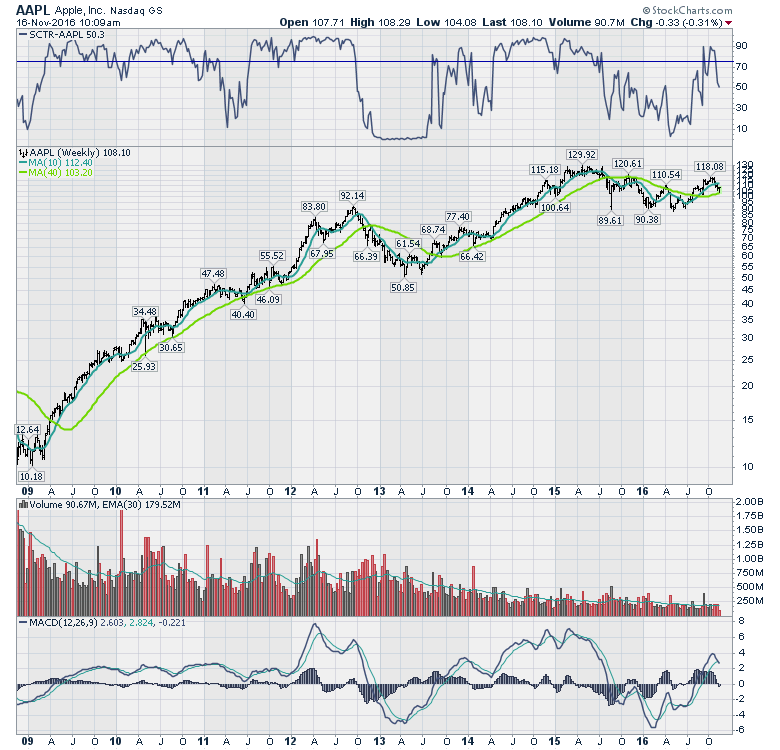
A great example is Apple's chart over 8 years. We all know the product cycles they have had so it is a great reference stock. The SCTR shown at the top shows AAPL above 75 (blue line) and below. The SCTR helps point out when the stock is in favour and when it is not. Avoiding the down periods over an 8 year time frame would have delivered a lot more profit.
 The market seems particularly tricky here. Global indexes are stalled, but America's indexes are surging. As a country that trades with the US for most of its exports, we need to participate in their growth.
Using the SCTR can help with theme investing. Being aware of which stocks are currently performing is helpful. As well, the SCTR can help show what investors are rotating into after such an extreme event as the change in leadership for the USA.
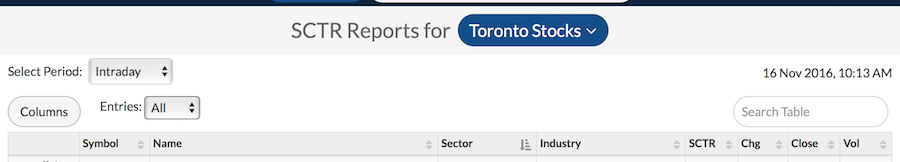
None of us can be right all the time about where the markets are headed. But being aware of the rotation into and out of industries can help you lock in profits and avoid large drawdowns. You can look at the SCTR tables for Canada here. Make sure you select the dropdown box at the top to Toronto. For investors looking outside Canada, select the appropriate index for you. As well, there are other tools including showing all the tickers in one long report (entries). Play with the new design of the SCTR page. You can sort by SCTR, then Industry group, then Sector. It will put all the ETF's or stocks that do not have an industry group assigned to them at the top but scroll down for the meat of the individual stock information.
 Use this tool to help stay well positioned in this shifting market. It's a difficult market that is moving fast. The buy and hold style was difficult for Apple investors and that was one of the strongest companies in the world. The SCTR helps us understand how the stock is doing compared to the other stocks in the market. Don't be caught holding the wrong stocks for a long period of time. It can be costly to your portfolio. All of the renewable energy stocks sold off hard on the election results. The SCTR's will help guide us when to reenter those stocks. Waiting could be a four-year or an eight-year period of under performance. I like to look for stocks just moving into the top quadrant above 75. They still have a lot of momentum. Based on some work Julius de Kempenaar did, only 60% of trades with good setups based on RRG worked out over a 9 week period. This is a good reference for any investor. So make sure to be aware of your potential for loss as well.
Even stocks that have a nice move have to be managed. The SCTR is one tool to direct you to strength and away from weakness. You still need to move in and move out to make and keep the profits. On the candleglance charts above, you will see the individual stocks SCTR rankings have surged above 75. The Airlines index does not have an SCTR reading as you cannot buy and sell that ticker symbol. It is an index and indexes do not have an SCTR.
Good trading,
Greg Schnell, CMT, MFTA.
