The Canadian Banks are pretty much jammed into every portfolio or ETF that tracks any part of the $TSX broad index. A person invested in Canada through an index tracking ETF would find it impossible to own Canadian stuff without the big banks. So that leads me to today's article. The Canadian banks are set up for a big move higher or a fail at major resistance. Let's take a look and then review.
I'll do them alphabetically by ticker symbol, but notice where the SCTR is on each one.
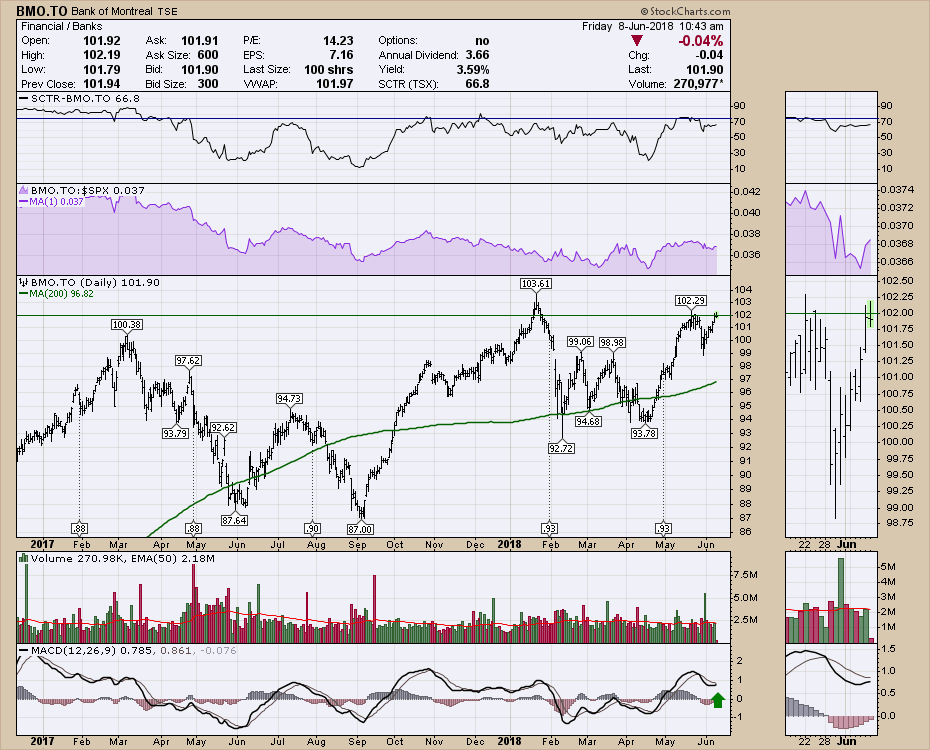
BMO. (BMO.TO)
We can see that BMO fell out of the 75 range in April of 2017 and has not reemerged as a top performer. Now the chart is set up to retest the January 2018 highs and is only 2% above the March 2017 highs. Hardly a fantastic return. I will say I like the MACD turning up above zero. With the SCTR at 66, it is better than 2/3's of the Canadian market but not tremendous considering the inclusion in the ETF's mentioned above. The SCTR has floated between 30-70 for the last year suggesting very average performance.
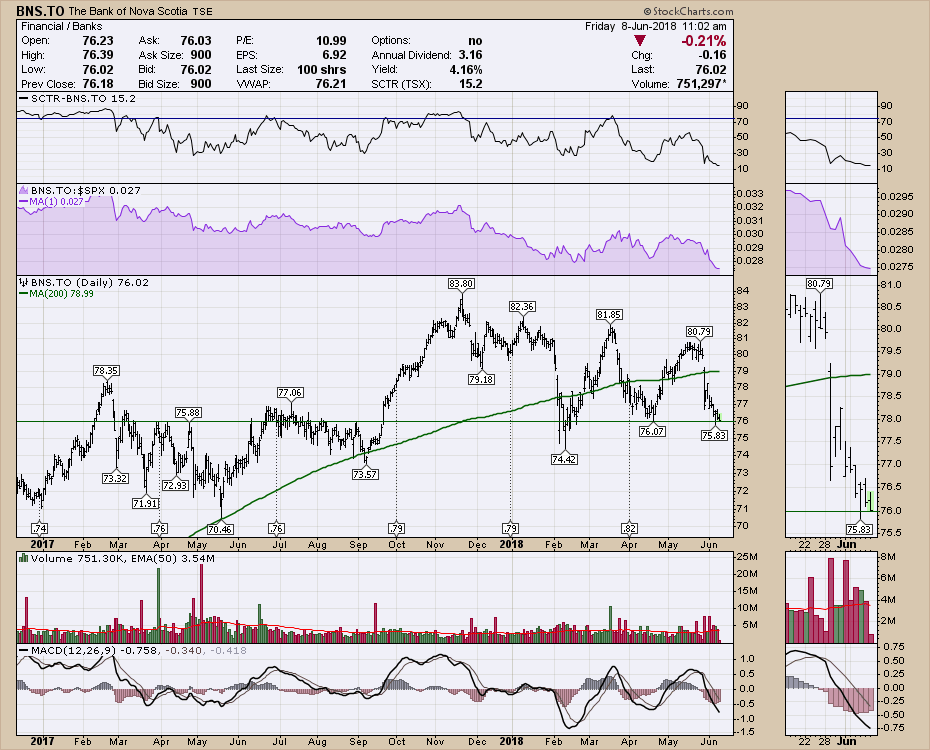
Scotiabank (BNS.TO)
This chart looks a little worse for wear. Near the low end of the recent range, the Latin American influence of Scotiabank's business might be weighing on the chart. New lows on the SCTR and new lows on the relative strength in purple compared to the $SPX. Price is in the middle of the 18 month range. Not my favorite at thsi point but if you like to buy at support, perhaps you'll like this chart.
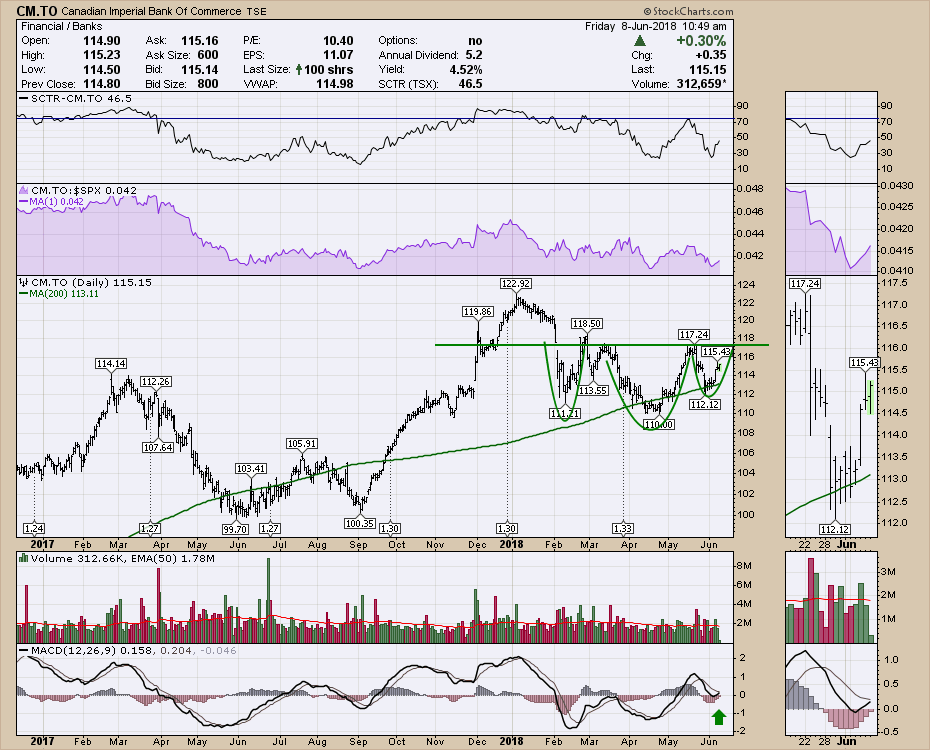
CIBC. (CM.TO)
CM.TO is currently trading at $115 which is only a $1 better than March of 2017. I will say that when CIBC goes on a run, it really goes on a run. Look at the positive MACD crossovers around zero. Those look pretty tasty. The three I am referring to are February 2017, September 2017 and November 2017. We currently have the MACD turning up to create a positive cross over right at the zero level. Lots of room to expand to the upside.
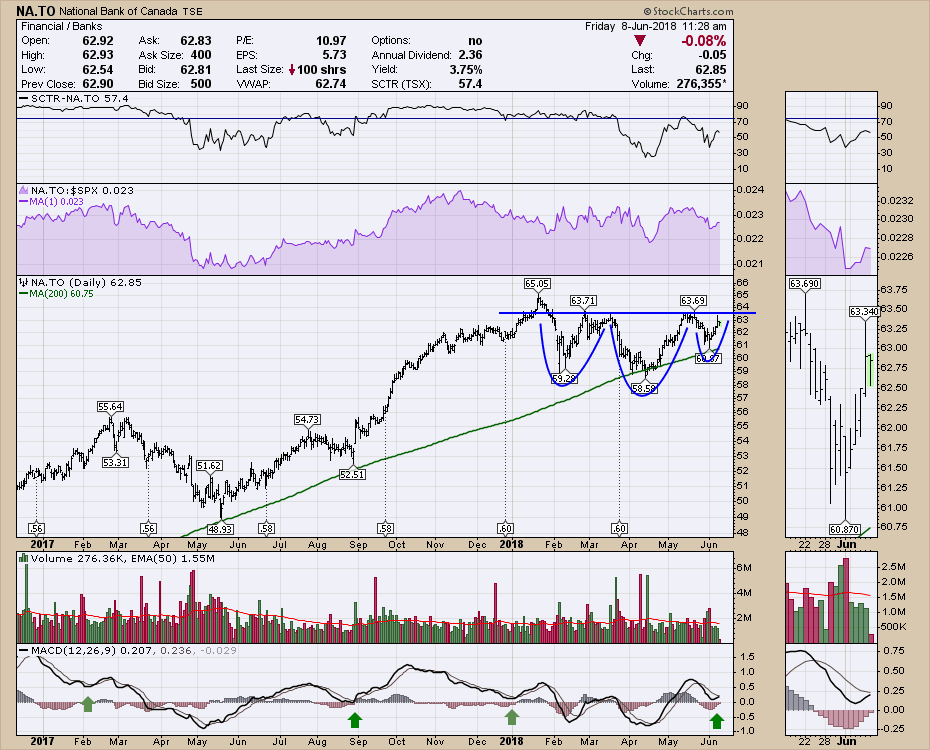
 National Bank. (NA.TO)
This chart looks ready to break to the upside. After a stunning run from May to January, the chart has been consolidating and looks ready to break above resistance soon. Look at the little turn on the MACD just above zero.... Nice! On a break above $63.80, I would want to own it with a stop right under at $63.
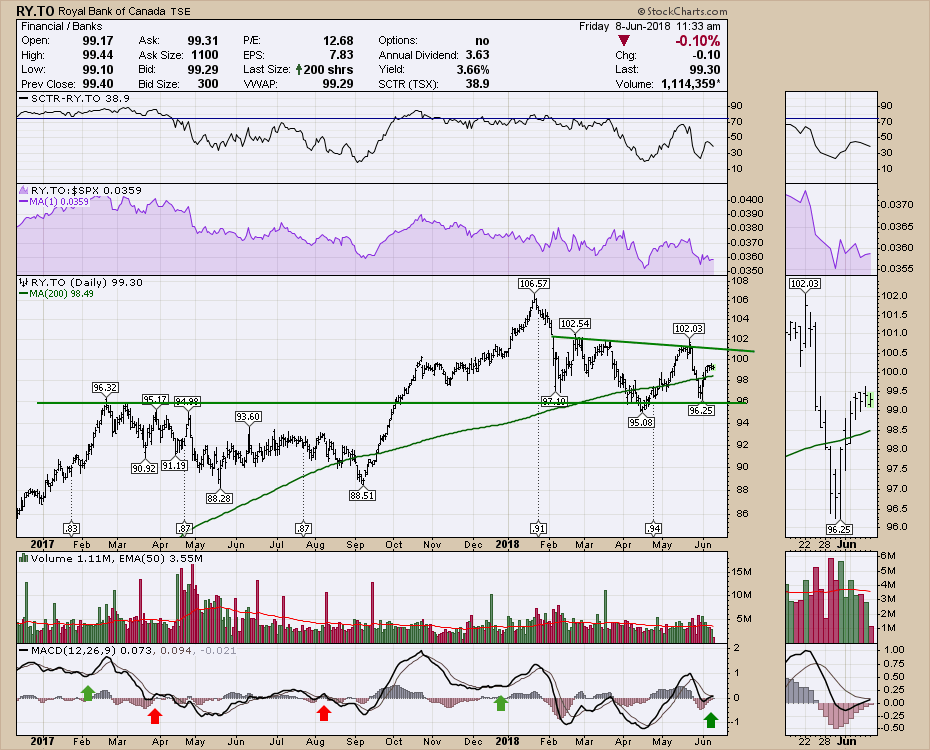
 RBC (RY.TO)
This chart is a lot harder to see what it wants to do next. The relative strength is near the lows of the chart. Yuck. Much like BMO, the SCTR has resided at or under the 75 level since April of 2017. As Canada's largest bank, the price is 2% above the February 2017 high. Pretty much dead money as this chart is adjusted to include the dividend. We can see the 200 DMA riding through the chart and the price recently cleared it again so at least that is positive. The MACD positive crossovers haven't been as informative on RY.TO as the other charts. A fail right here at zero would be painful. Conversely, if this is a turn up right near zero, that is a great entry.
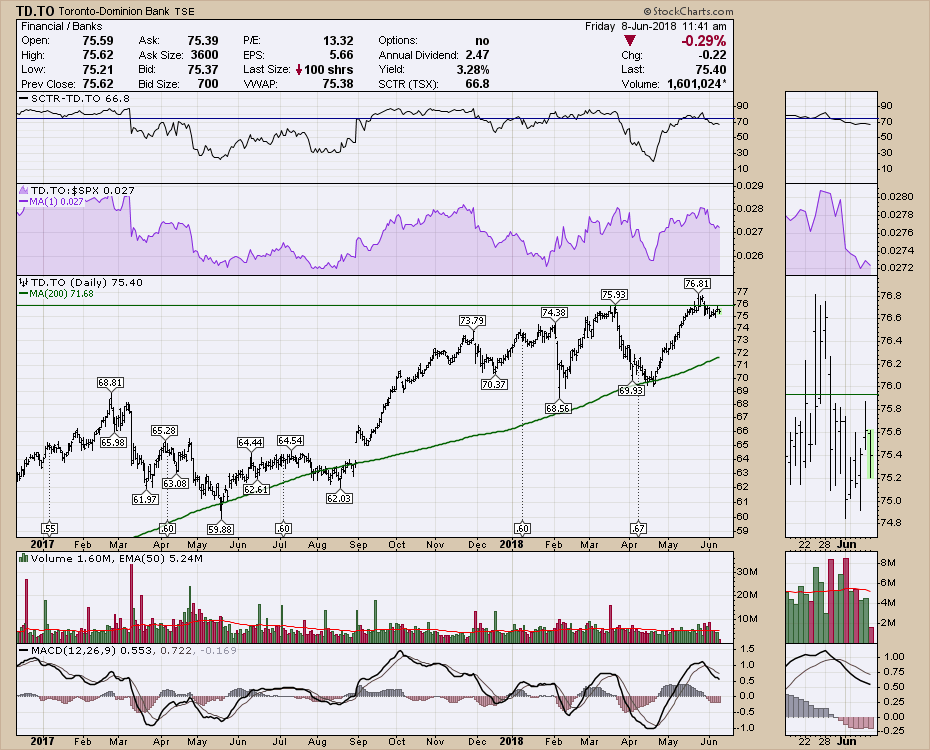
 TD Bank. (TD.TO)
The SCTR shows TD trying to perform better than most of the charts above. The Relative strength is close to 12 month highs which is nice. Price action is clearly the most bullish of all the charts with a fresh new high in late May. I don't like how the swings since November are getting wider and wider. This sort of wild swinging is indecision in action. If the MACD turns higher soon, I would expect a meaningful breakout on TD and its clearly the strongest chart.
 Summary,
So after a complete look through, I am the most optimistic about National Bank. The CIBC chart looks as primed as the National Bank chart. BMO.TO looks good as well. The wild swinging on the TD chart doesn't usually end in a move higher. Hey, I could be wrong as the price is currently stronger than any other chart. If RBC can turn higher and push through $102, that would be a good move to participate in. Scotiabank's chart looks troublesome, but they never sell off too much unless the whole group starts breaking down here.
We have a Fed meeting next week which is expecting a rise in interest rates in the US and Quadruple Witching Options Expiration on Friday. The current rise in the US interest rate is built into the charts.
I would say this to summarize. If CM.TO, NA.TO, TD.TO and BMO.TO all break out in unison, you'll definitely want to take a ride on the banks. If they stall here just under resistance, I would avoid them. I am sure RY.TO will participate to the upside, should they start to roll. Not as sure about the BNS.TO chart but the ETF tracking would probably lift it a little bit as well. To answer the title's question: I don't think there is trouble in paradise on these Canadian banks, but it is time to watch them closely. They have to break out here and could be timely. Otherwise continue to ignore the dead money trade.
I discuss a lot of the variables ($SPX at resistance, Fed meeting, Options expiration etc. ) on the Canadian Technician video recorded earlier this week.
I host a new TV show on StockCharts.com called The Final Bar. It airs Thursdays at 5 PM ET and is repeated throughout the week on StockCharts TV. You can also catch it on my Vimeo channel or on the StockCharts.com YouTube Channel. Here is Thursday's copy. I focused on Consumer discretionary stocks.
Good trading,
Greg Schnell, CMT, MFTA
Senior Technical Analyst, StockCharts.com
Book: Stock Charts for Dummies
Twitter: Follow @Schnellinvestor
