In a positive week for the markets, the unease has not lifted in my mind. First of all, a little perspective on what was leading. On Friday, the sector performance was skewed to safety. The defensive sectors align on the right hand side of this performance chart.
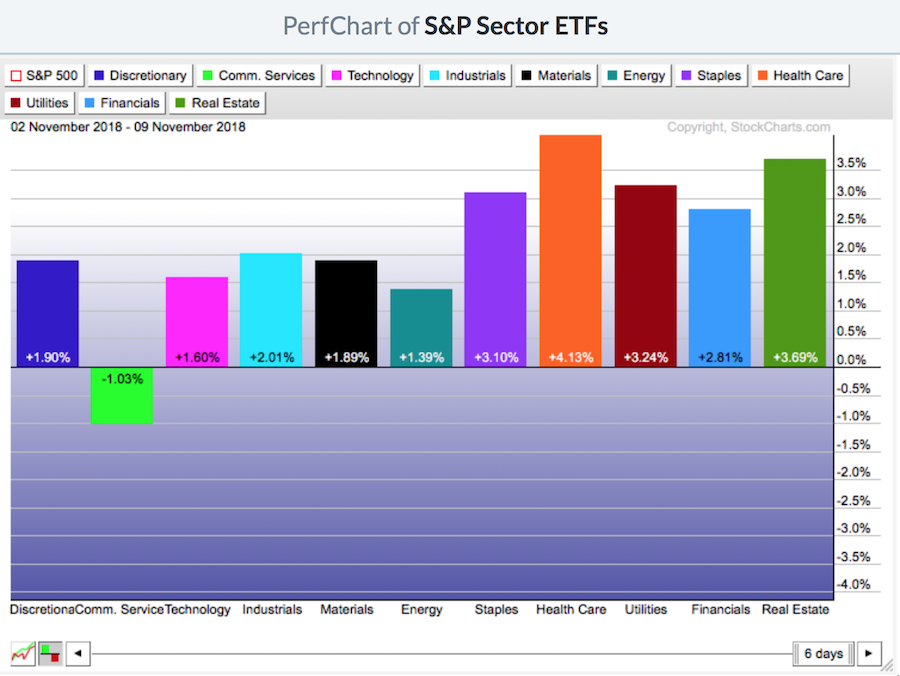
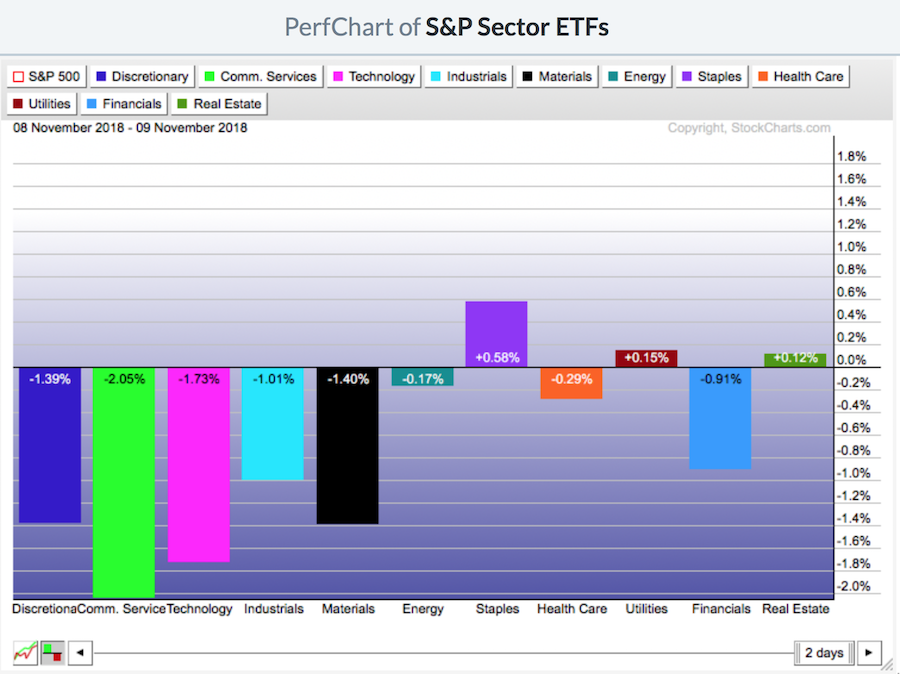 Over the past week, the defensives were up the most, and the growth charts were not up as much. While almost every sector had a positive week, the defensives still led. If I backed out Friday, it was more even but the defensive areas of the market had a stronger week. The chart below shows all of last week.
 One of the concerns I see in the market is how the market has been reacting to Fed meetings, with the last one being Thursday. It has been extreme movements after each Fed meeting, either higher or lower.
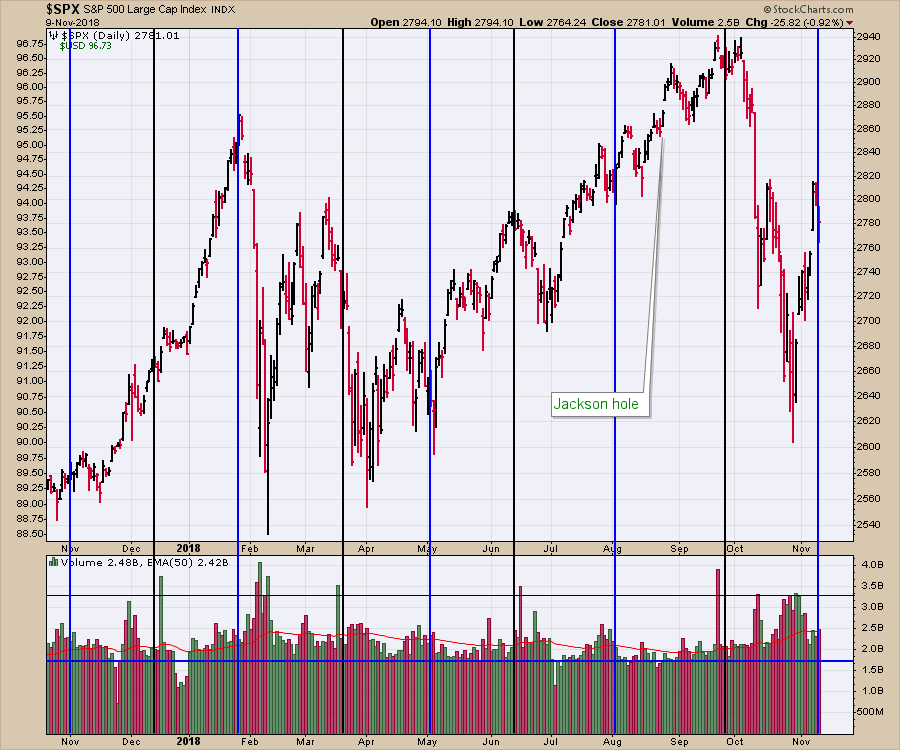 With the Fed backdrop and the market aligning defensively on Friday, it does add to concerns.
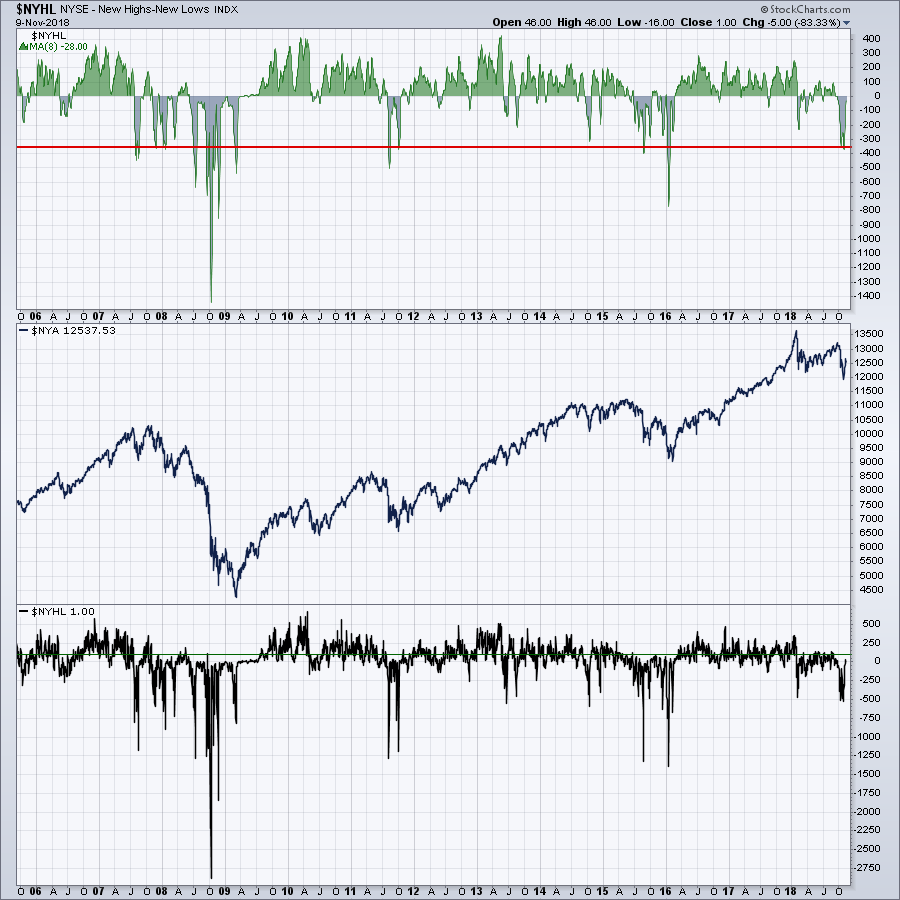
The breadth readings have return back to the normal levels. One I like to keep watching is the net new highs. If it can't get above 100, it usually means the market needs more time to get bullish. The bounce has been big off the lows so it is definitely trying, but that is how bear market rallies work. They run up quick so people have a fear of missing out, only to reverse right after they buy into the market. In the chart below the lower panel shows the individual day readings and is currently at 1. Notice the green line marking 100. Look left on the chart and you can see that 100 is a pretty good level where the big market pullbacks have topped out. On the top panel, using a moving average of the highs struggles to get much above 0. The MA reading is currently -28 in the legend. All that to say this is a timely place to pay close attention.
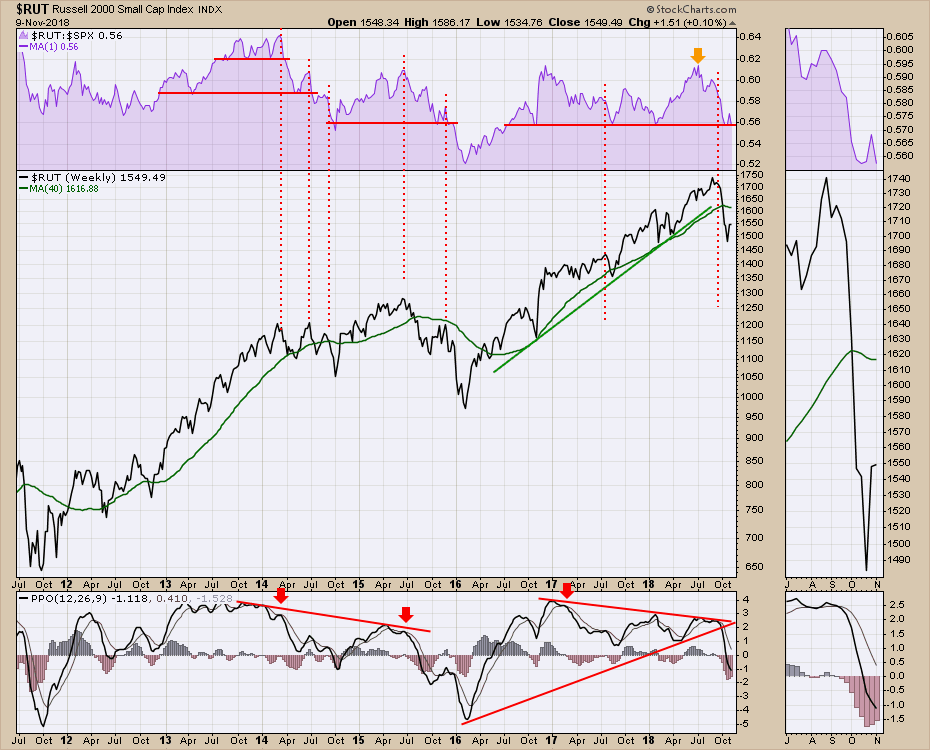
The $RUT chart has a few important features this week. One of the most important levels is the relative strength (RS) chart. The peaks on the RS chart does not always represent a drop in the market. However, it does seem that when the RS breaks down and leads the market lower, each lower level leads to more selling. 2014 and 2015 are good examples of that. In the zoom panel on the right, we see the RS at the level of 2-year lows. Any major break of that level could be an excellent clue of where we might be going next, suggesting down.
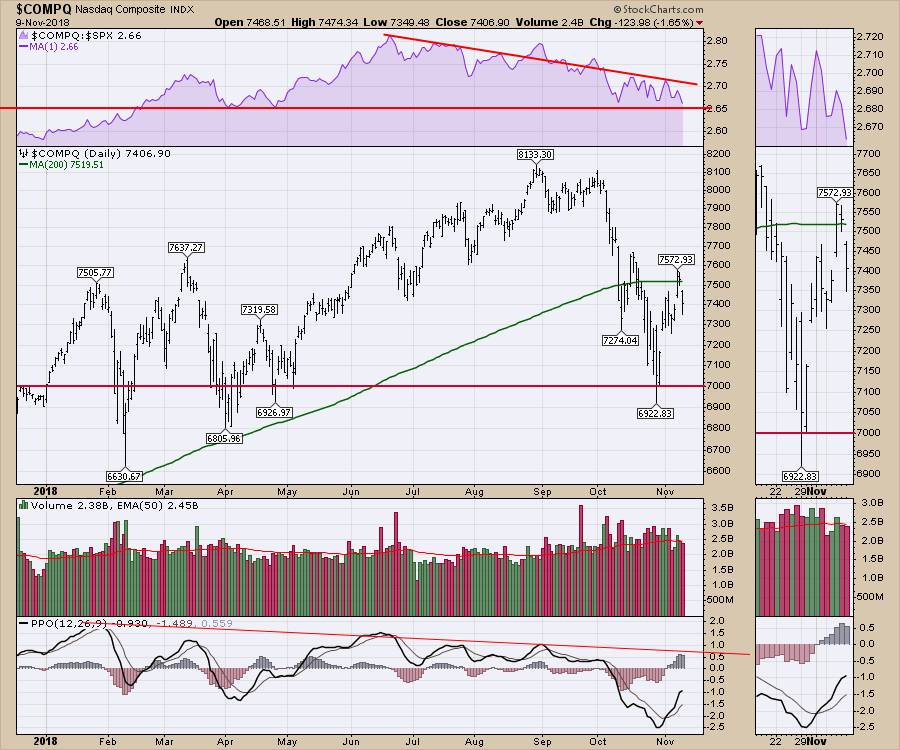
 The $COMPQ is also testing an important RS line as well. If both of these markets fail, I am interpreting a deeper leg down.
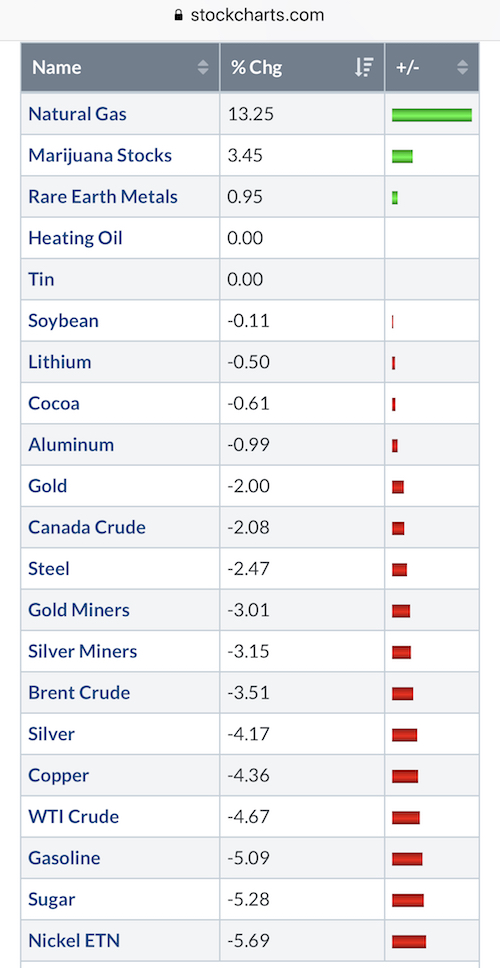
 Rolling into the commodities, it was a very tough week. The marijuana related names plummeted, then soared, then plummeted. That all happened inside a week. Crude oil fell into the fifties and closed marginally above $60. Gasoline made new 52-week lows. Natural Gas was up huge on the week. But the Natural Gas related stocks fell in sympathy with crude oil. Copper and steel fell hard. Gold fell hard after the Fed meeting and gold miners fell with it as well. Needless to say, commodities look like there is more downside to come.
 So I would mark the rally as precarious, but the seasonality is very bullish. I think the next two weeks are really important. The global macro situation looks rough. Be very cautious here.
Here is this week's broad market review video.
The Canadian Technician video shows the bounce off the late October lows in Canada. Canada is back below the 2008 highs. Tough ten years for investors.
This video covers off some of the recent price action since the late October lows. It also covers the areas where we may expect resistance through the upcoming week. The drop in oil has been huge and this is discussed on the video.
If you are looking for a small gift, you might have family or friends that would like to learn more about the basics of charting. The first section of the book walks through all the chart settings to get the charts you want. The second section is why you might use charts for investing and the third section is putting it all together.
Click here to buy your copy today! Stock Charts For Dummies.
If you are missing intermarket signals in the market, follow me on Twitter and check out my Vimeo Channel often. Bookmark it for easy access!
Good trading,
Greg Schnell, CMT, MFTA
Senior Technical Analyst, StockCharts.com
Author, Stock Charts for Dummies
Hey, have you followed me on Twitter? Click the bird in the box below!
Want to read more from Greg? Be sure to follow his StockCharts blog:
The Canadian Technician
