- Gold Pops
- Oil gurgles
- Marijuana Miners move
- Lumber keeps building
- Indexes pause
- World markets outperform US markets
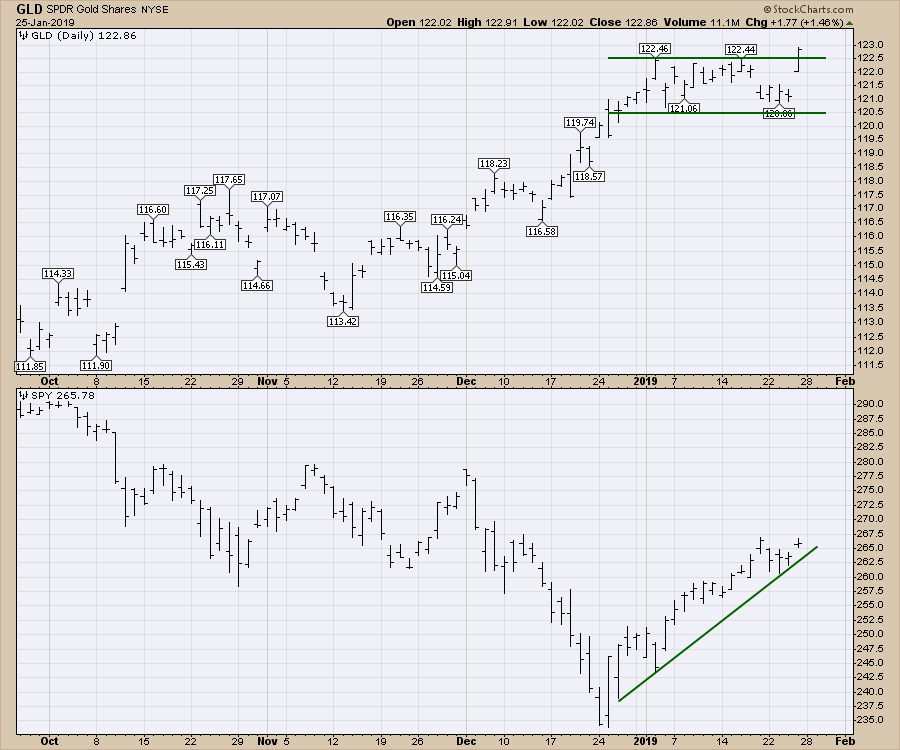
On Friday, the Gold chart finally broke out of a five-week flag pattern. While gold was one of the best performers in the fourth quarter, it had paused while the equities rallied. Does Friday mark a meaningful trend change for Gold and a resumption of the bear for equities?
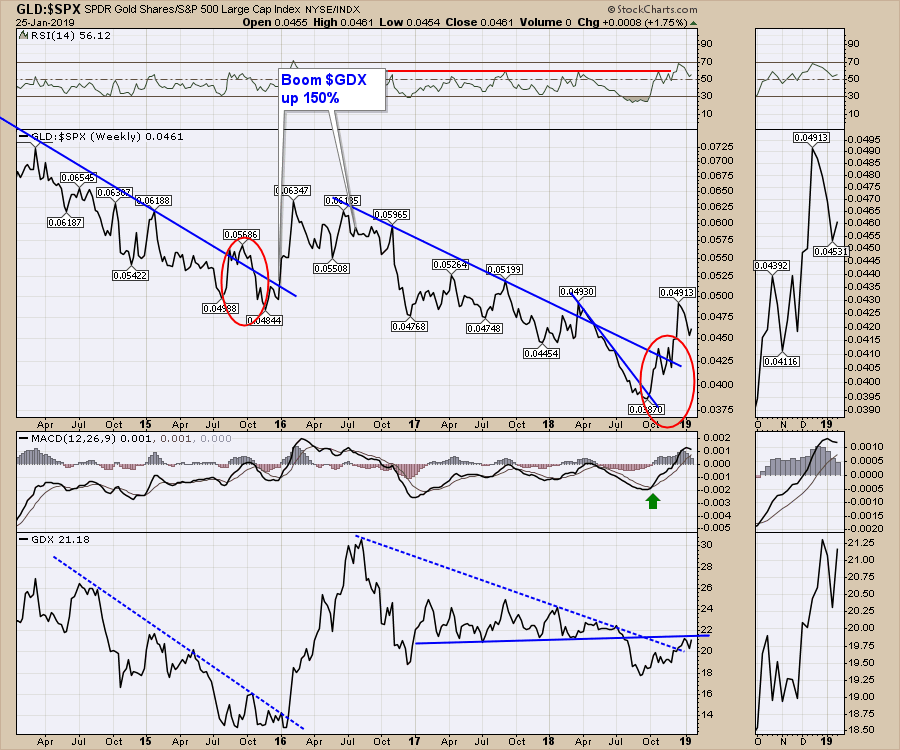
 Ignoring the broader equity markets for the next few charts, you can see in the lower zoom panel that the gold miners responded nicely to this week's gold move. Gold has been outperforming the $SPX since the first of October, but the move on the miners has been muted. The recent break of the GDX dashed blue trend line was good, but we haven't seen a surge like we did in 2016. Perhaps Friday will mark the start of that big broad GDX surge.
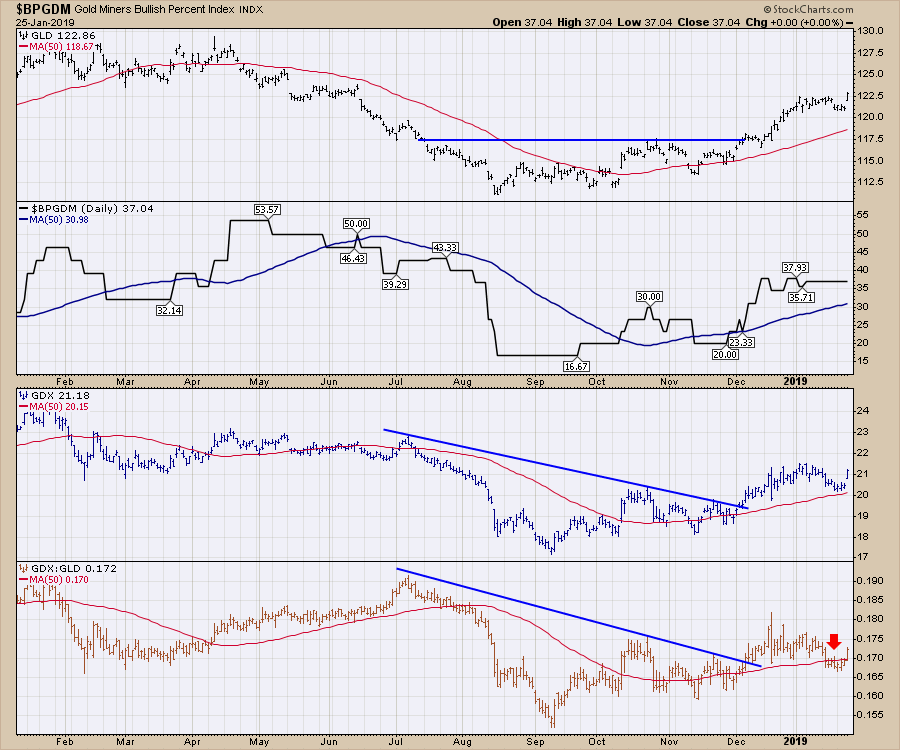
 The Gold Miners Bullish Percent Index is still weak and remains under 50%, having hovered around 37% for nearly 2 months. When all four of these panels are above the 50-day moving average, it's bullish. Last week, the GDX:GLD dropped below the 50-day adding caution. Friday's move sets up another buy.
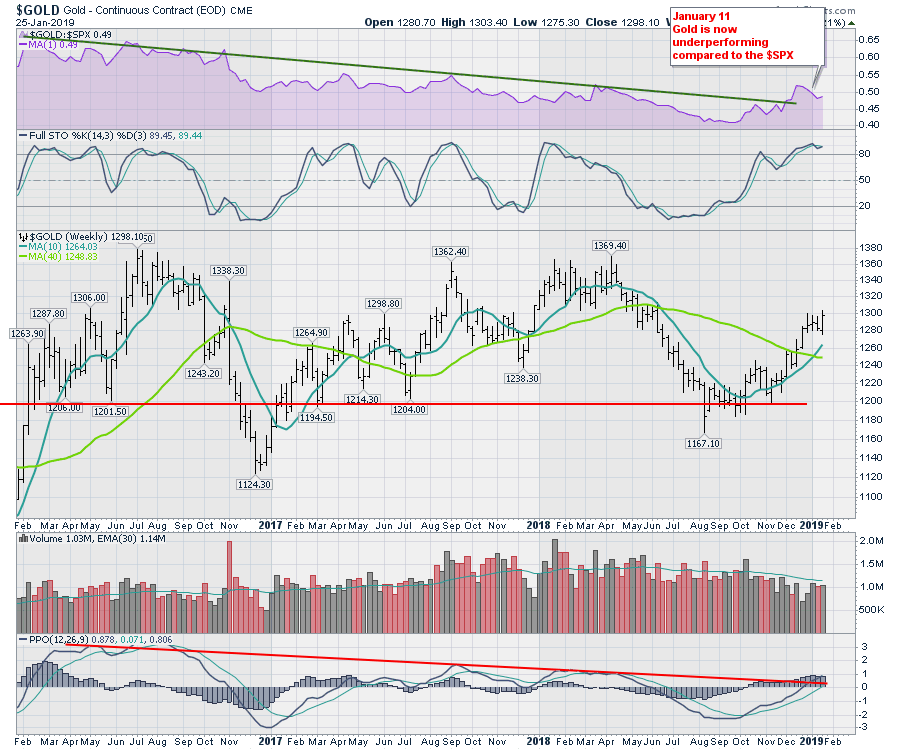
 One last thing about Gold; this move was at a critical place on the weekly chart. Gold had briefly started to underperform the $SPX (top panel) since the equity rally started in December. With the momentum shown on the PPO starting to roll over, this signal had shown up on the Gold chart at this level a few times before. There was a very good reason to be cautious in 2017 and April 2018. This move on the weekly price bars gave us a bullish engulfing bar.
 Oil didn't do much this week and the oil stocks did even less. They were the worst performers in the major ETFs.
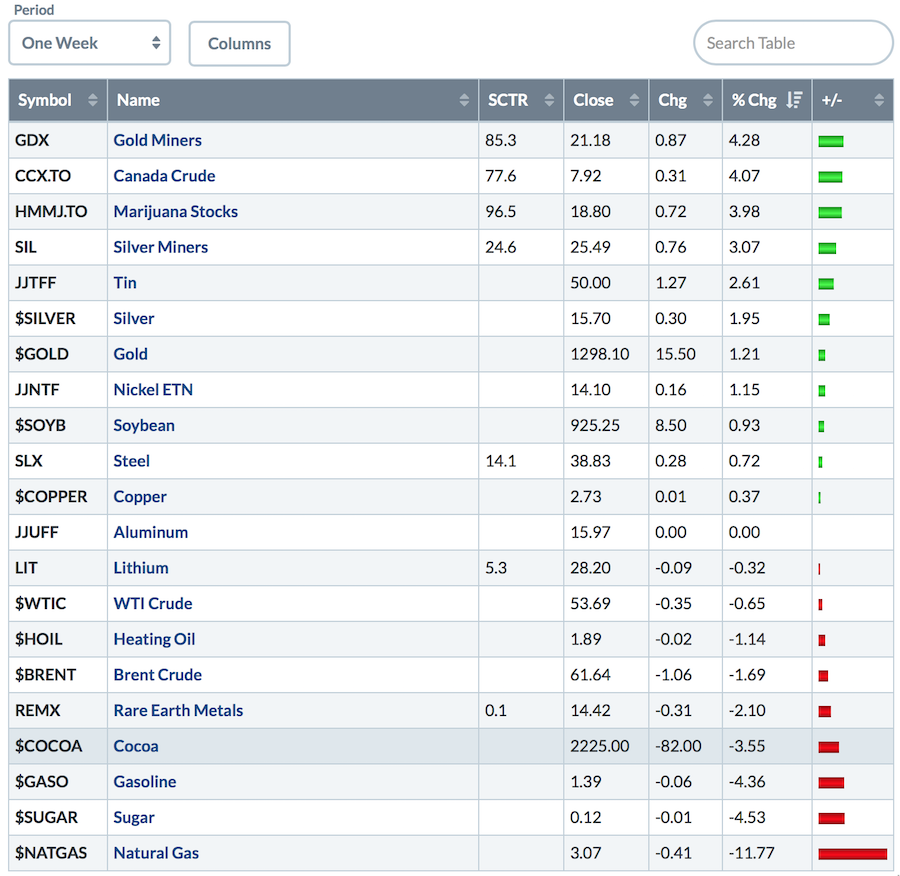
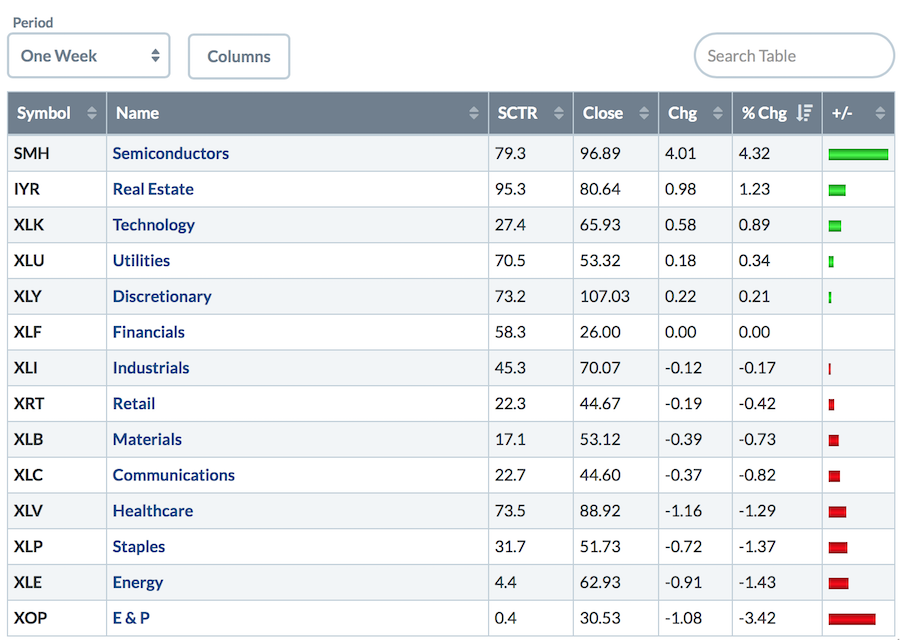 Natural Gas, which can be very volatile, has been swinging wildly. That can be great for day traders, but is less great for the buy and holders. This week, it gave up over 11%. At the top of the list is the gold miner move. Silver miners also had a nice move as well. The marijuana names continued their torrid pace, while Steel, Copper, Rare Earth Metals and Lithium all got hurt.
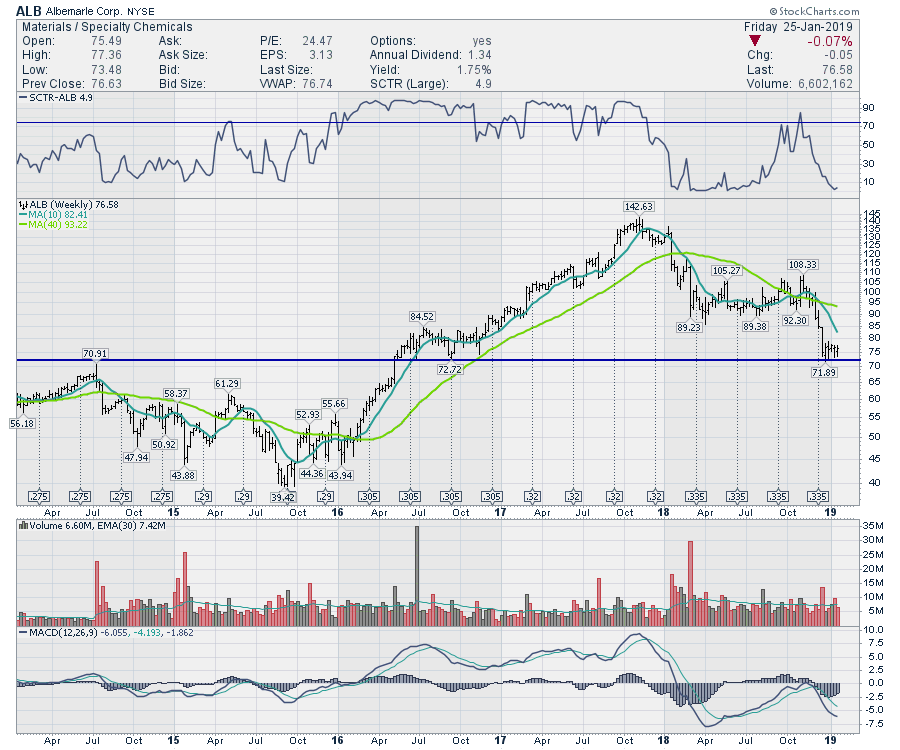
 The chart for Albemarle fell off a waterfall a few weeks ago. The stock is in the Lithium space and the chart has not rebounded at all in the last five weeks; while the selling momentum has broken, the PPO is still in the process of trying to turn up. While I am encouraged by the electrification of cars, we need the price action to confirm.
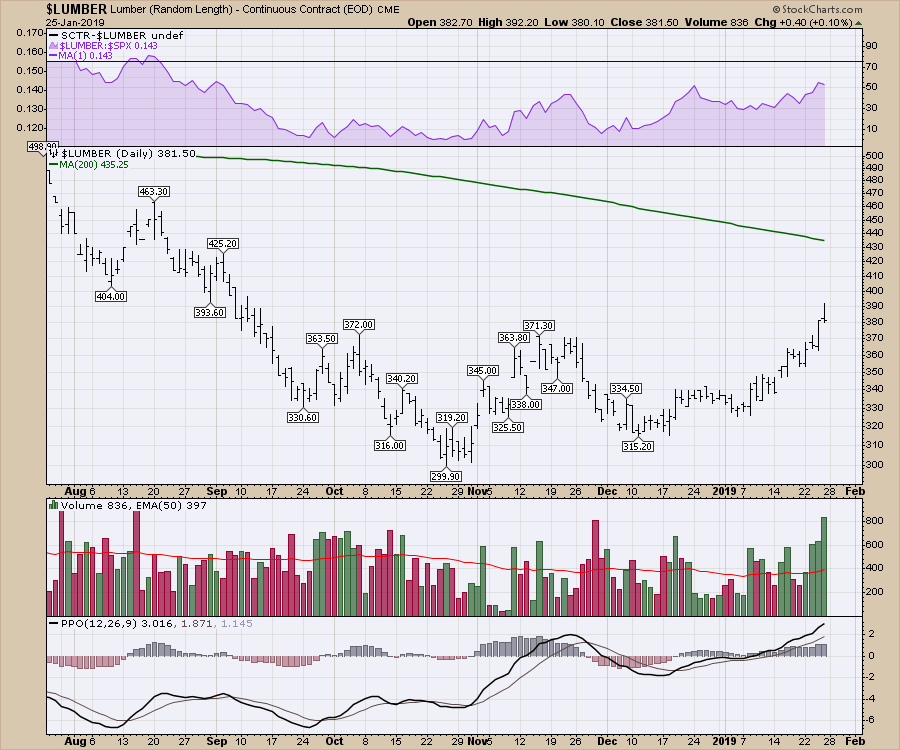
 Wrapping up the commodities, Lumber continues to make a positive move. Friday's close was at the low end of the bar on higher volume; perhaps it needs to pause here.
Canada had similar price action to the USA this week, though it did manage a higher high.
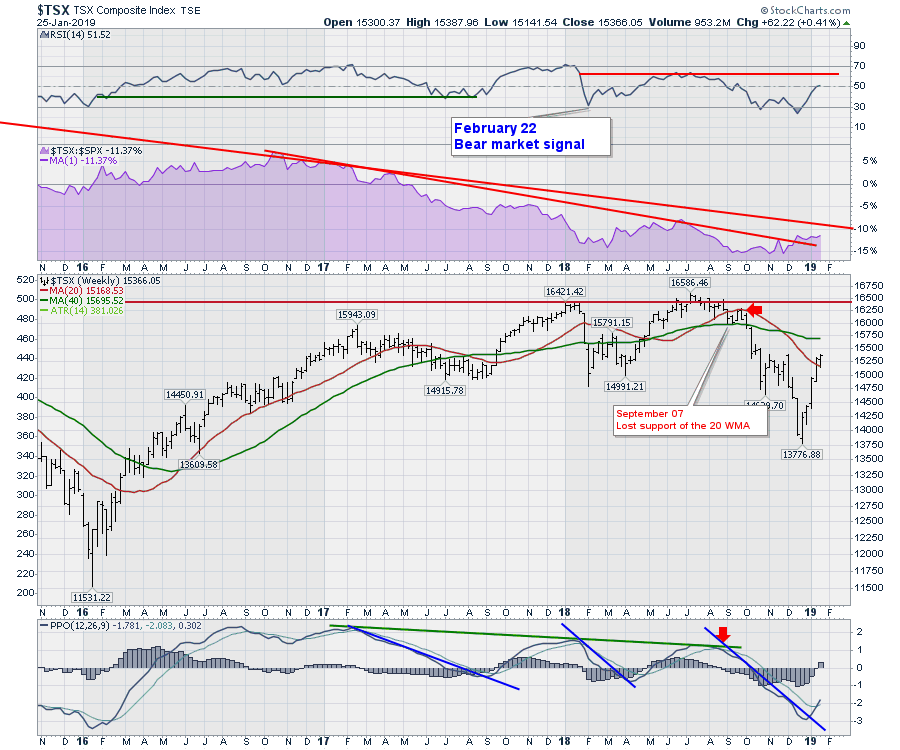
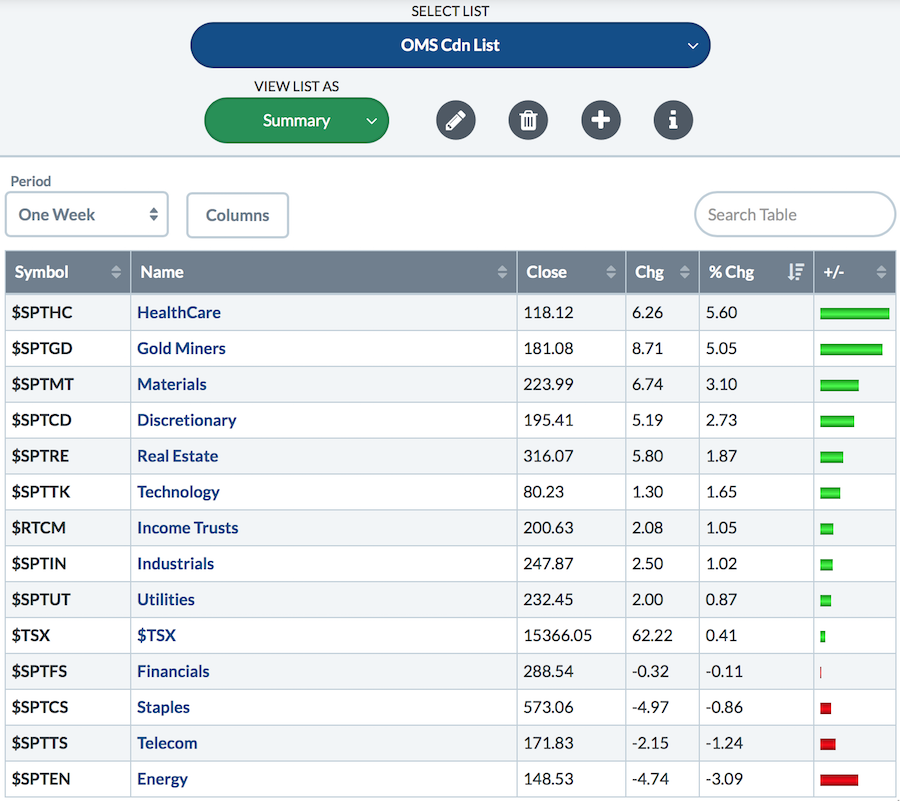 Here is the $TSX for Canada. On the video this week, I mentioned a break above 15400 would put a buy signal on the P&F charts. The trend line and signal line on the PPO have been broken to the upside, meaning the momentum signals are bullish.
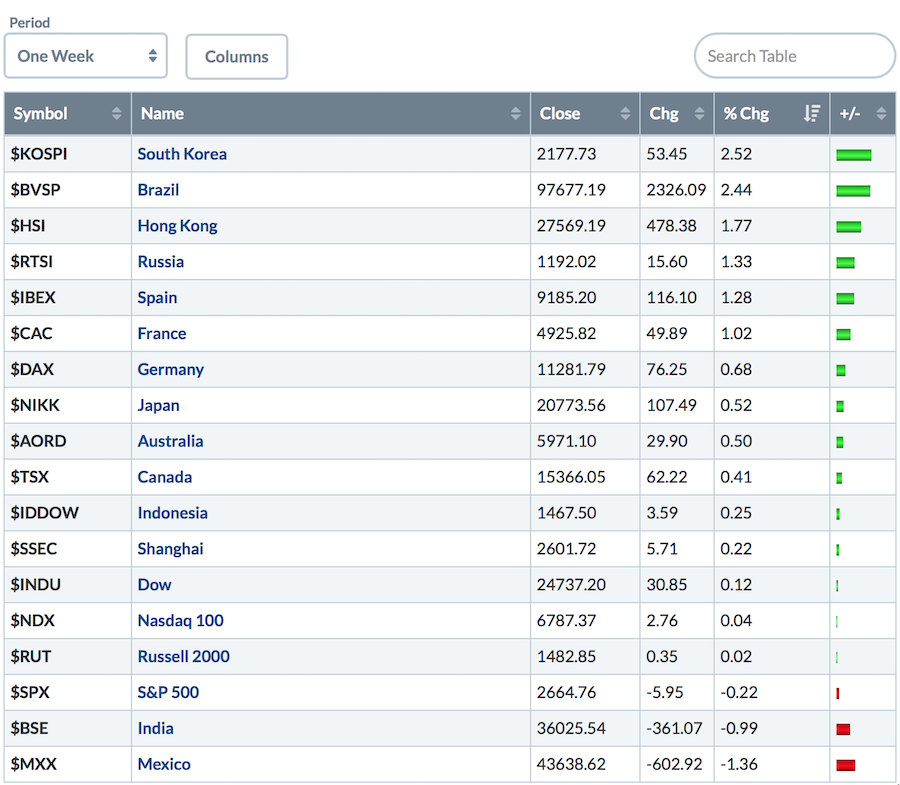
Speaking of foreign markets, the global indexes performed better than the USA, for the most part. Two of the top four were commodity countries, while Europe was in the middle of the pack this week.
 We also have the Federal Reserve meeting next week. This one caught me off guard a bit, but they meet roughly every six weeks, so I figured that it should be soon. Sure enough, it's happening next Tuesday and Wednesday, which should give us some fireworks to end the month. Davos didn't seem to have any impact as none of the trends reversed. It's good to be focused on the price, not so much on the commentary that infiltrates the market. In this particular case, all the weekly charts are still intact.
A lot of charts are making bullish turns this week. If you are looking for some positive areas of the market to investigate, I would strongly encourage you to view the Weekend Market Roundup video, which you can also find in the "Canadian Technician" articles. Follow this link to "The Canadian Technician" and don't forget to subscribe.
I had two shows this week for Market Buzz on StockCharts TV, where there have been some beautiful sector setups to talk about recently. This new show is dedicated to weekly timeframe investing. Please follow me on Twitter and subscribe to my blog for regular updates.
There are some Canadian charts that look outstanding! This is my Canadian Market Review.
If you would like to learn more about the basics of charting, check out Stock Charts for Dummies. The first section of the book walks through all the chart settings to get the charts you want, the second section explores why you might use charts for investing and the third section is about putting it all together.
Click here to buy your copy of Stock Charts For Dummies today!
If you are missing intermarket signals in the market, follow me on Twitter and check out my Vimeo Channel. Bookmark it for easy access!
Good trading,
Greg Schnell, CMT, MFTA
Senior Technical Analyst, StockCharts.com
Author, Stock Charts for Dummies
Hey, have you followed Greg on Twitter? Click the bird in the box below!
Want to read more from Greg? Be sure to follow his StockCharts blog:
The Canadian Technician
