This week marked the sixth consecutive one in which the Canadian market traded sideways. Personally, I find it hard to get excited about a market going sideways. More concerning is the fact that the main areas of the Canadian market are not showing improvement.
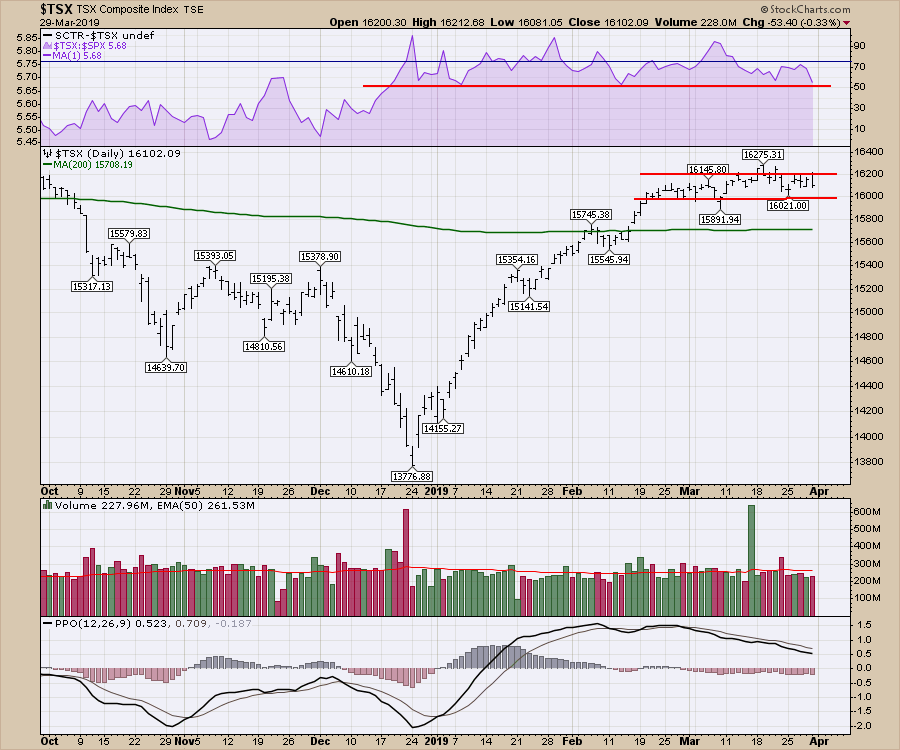
On the chart below, you can see that the $TSX has traded between 16000 and 16200 for six weeks. Only two days closed above 16000; both dropped back into the channel by the next day. At the top of the chart is a relative strength chart, wherein we can compare the $TSX trading relative to the USA S&P 500 ($SPX). When the $TSX trades in line (sideways) or outperforms (up), this has been a clue that things are okay while the $SPX is in an uptrend. New three-month lows on the purple relative strength chart would be concerning. Friday closed the daily, weekly and monthly charts at the low end of the range.
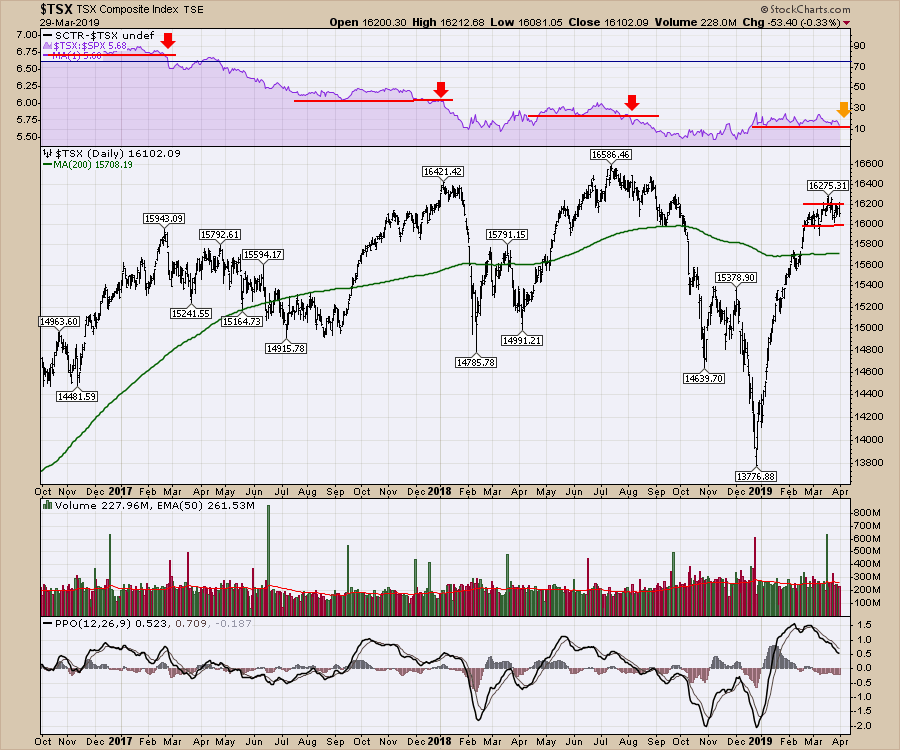
 Here is an example over the last couple of years. The red arrows show the breakdown in relative strength following uptrends.
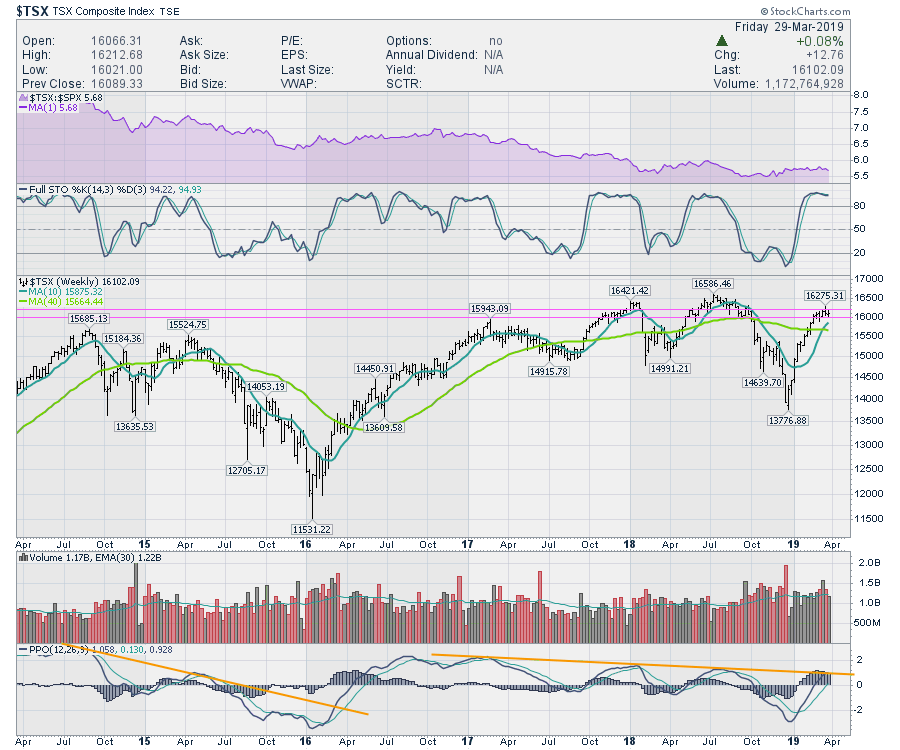
 On a weekly chart, the $TSX is stuck in an area of major resistance. The market has struggled to surpass the price of 16000 for ten years.
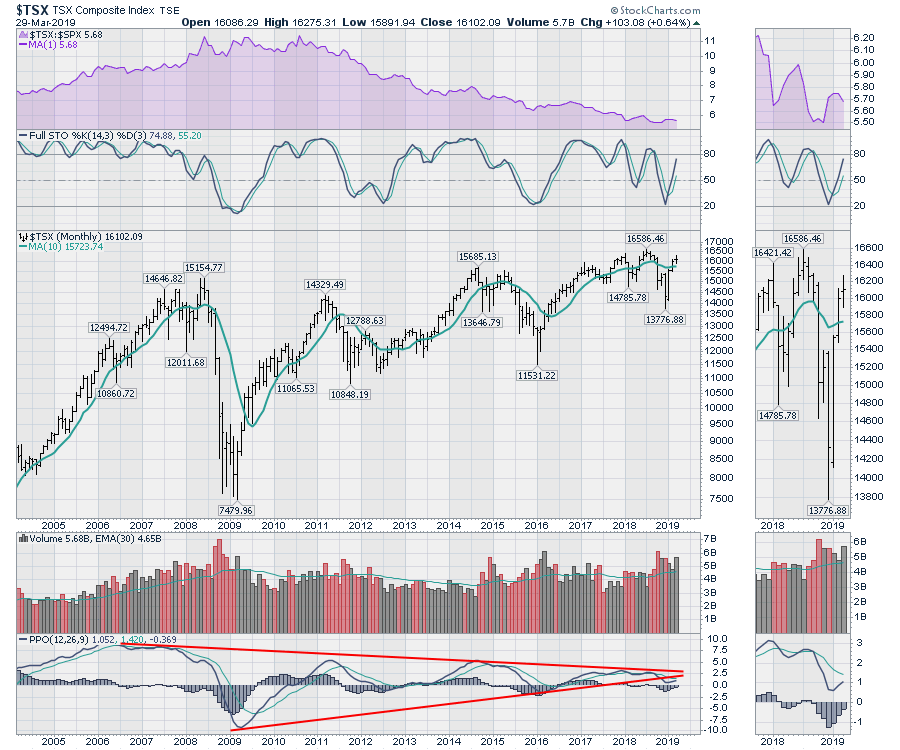
 The monthly bar for March is a doji. A doji is a situation where the price ends at a similar level as where it started the bar, representing stalling momentum or indecision. The term doji actually refers to a candlestick chart style, but the principle is the same. A bullish opinion would say we made higher highs and higher lows this month. The zoom panel at the bottom shows the PPO making lower highs and lows on momentum. Regarding the big picture, we still need to get a new uptrend in momentum started.
 Of the four areas that are important for Canadians, all look weak.
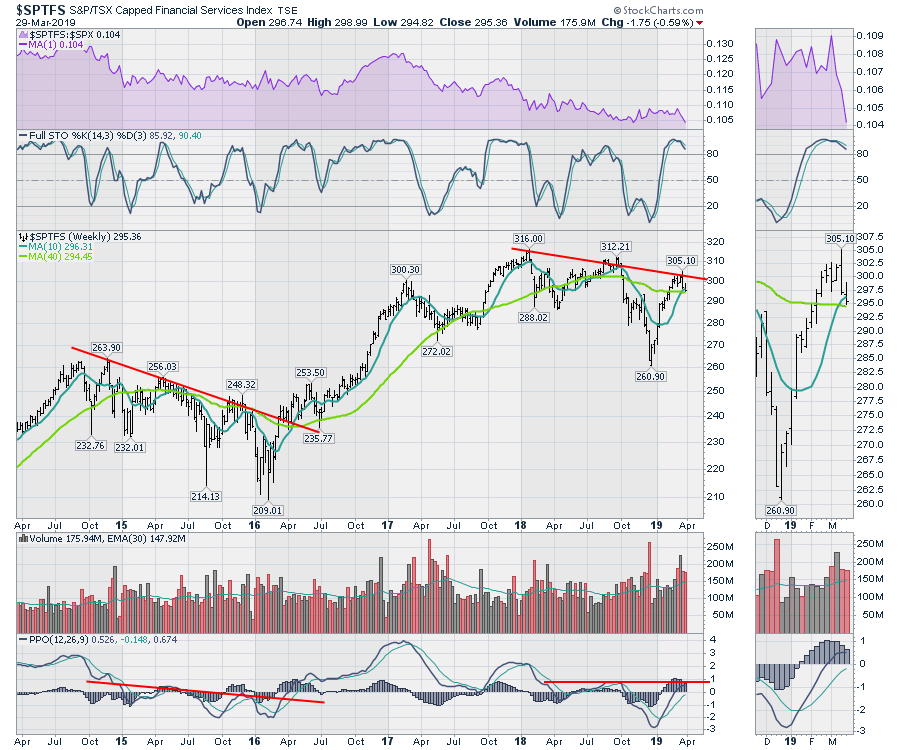
The Canadian financials made lower lows and highs this week. So far, the chart looks like a repeat of 2014-2016. On the zoom panel, we closed below the 10-week moving average and above the 40-week moving average following a big outside reversal bar last week. A reversal bar is one that has a higher high and a lower low than the previous week. This week, it continued to make lower highs and lower lows, confirming the reversal bar. My expectation is for lower levels.
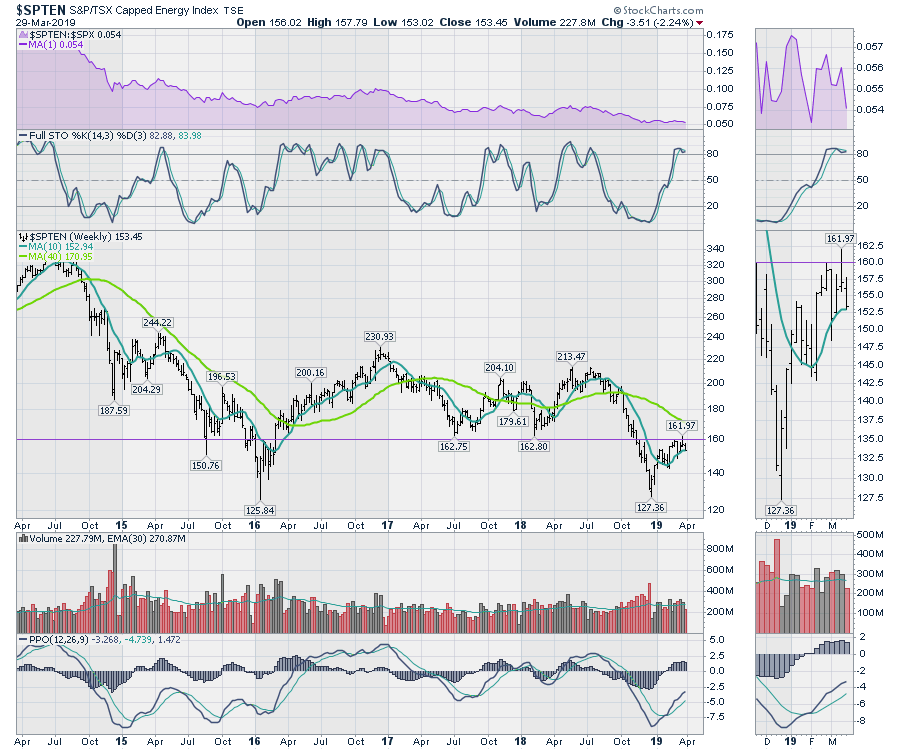
 Energy looks weak as well. Looking in the zoom panel, you can see that the price has stalled at the 160 level, which used to be support in 2017 and early 2018. Now, it looks like the price is having trouble breaking through. Last week had a failed breakout; the bar opened near the lows, tried to go higher, couldn't hold up and closed near the lows. This week, the price bar made lower highs and lower lows. The price is trying to hold above the 10-week moving average. Based on looking through many of the energy charts individually, I expect lower prices.
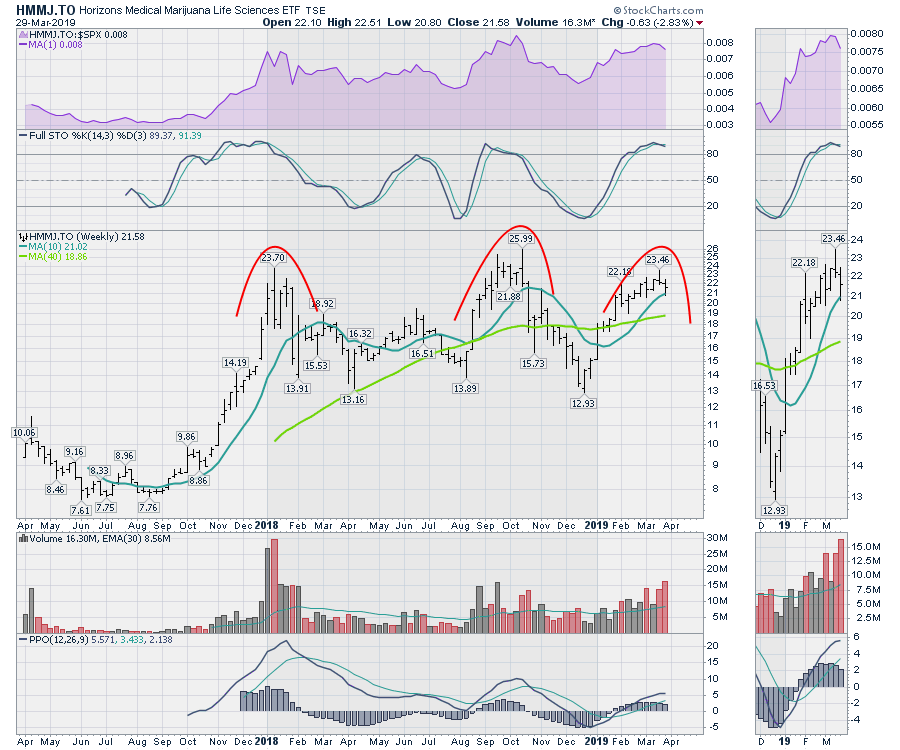
 Marijuana stocks continue to drift lower. A few are holding up, but lots of them are breaking down. Last week had a failed breakout. The bar opened near the lows, tried to go higher, couldn't hold up and closed near the lows. This week, the price bar made lower highs and lower lows. The price is trying to hold above the 10-week moving average. Based on looking through many of the marijuana-related charts individually, I expect lower prices.
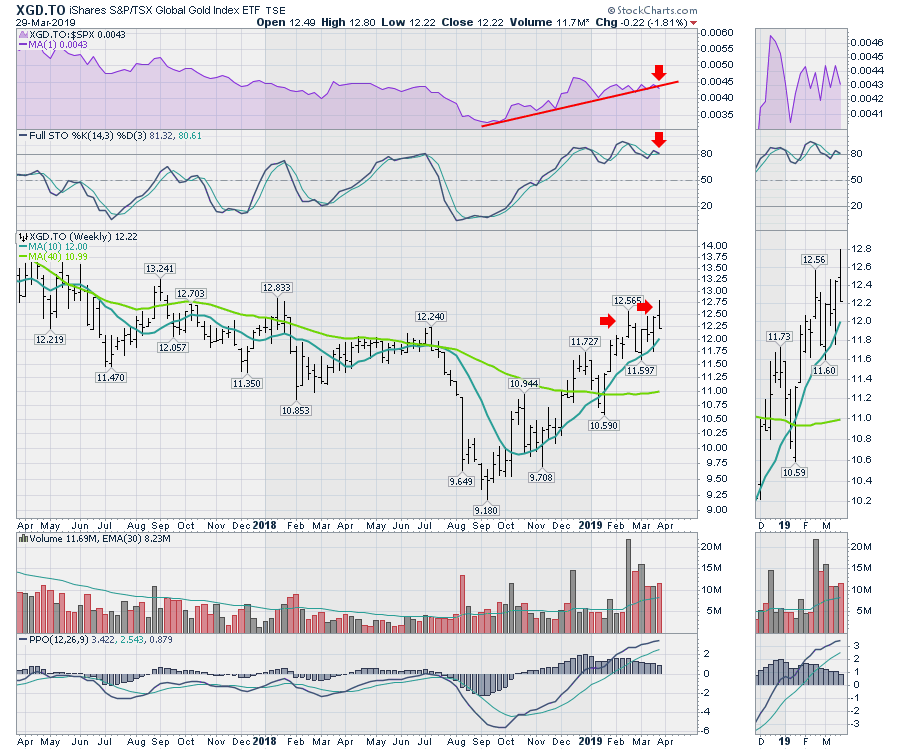
 Here is a chart for the Canadian Gold miners ETF. A few are holding up, but lots of them are breaking down. This week had a failed breakout; the bar opened above last weeks high, tried to go higher, couldn't hold up and closed near the lows. A few weeks ago, we saw the same thing. Seeing these bars with weak price action appearing close together adds to my concern. Looking in at individual charts of the leadership, such as Kirkland Lake (KL.TO) and Wesdome (WDO.TO), those charts are breaking down with lower highs and lower lows on the daily charts. This failure of leading stocks is worrisome. I would avoid the precious metals after Gold had an outside reversal bar this week.
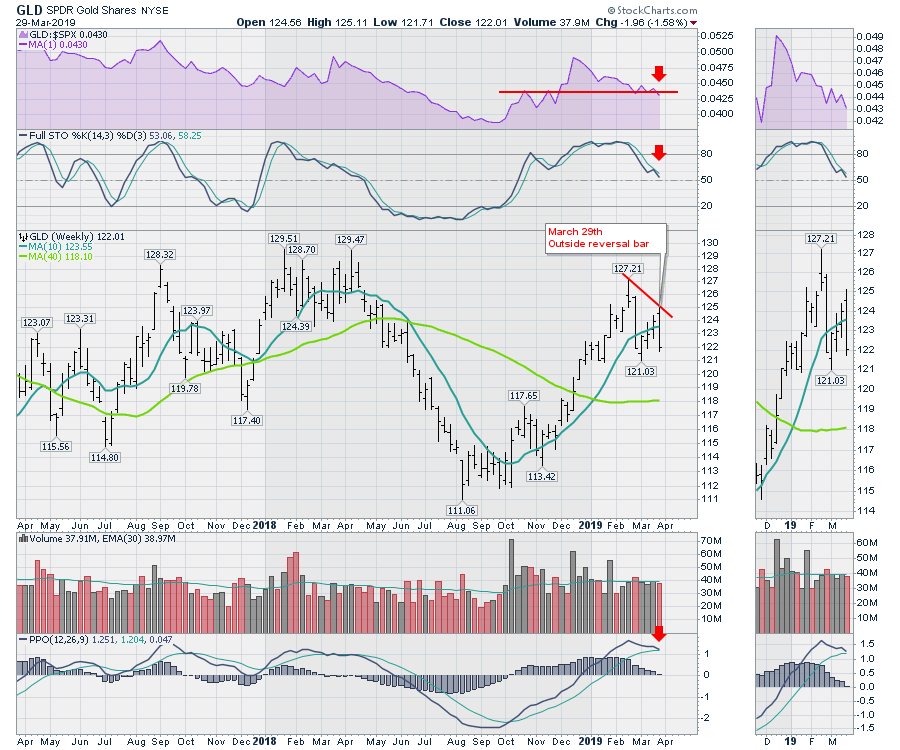
 Here is the outside reversal bar on the chart of GLD.
 With all of those charts worrying me, I am not optimistic about April at this point. I would need to see big upside reversals to get more bullish. Here is a link to the month-end video for the Canadian Market Review.

At least for the next little while, I am concerned about a major market rollover. We'll see if it transpires, but it has me focused on capital preservation.
Good trading,
Greg Schnell, CMT, MFTA
Senior Technical Analyst, StockCharts.com
Author, Stock Charts for Dummies
Hey, have you followed Greg on Twitter? Click the bird in the box below!
Want to read more from Greg? Be sure to follow his StockCharts blog:
The Canadian Technician
