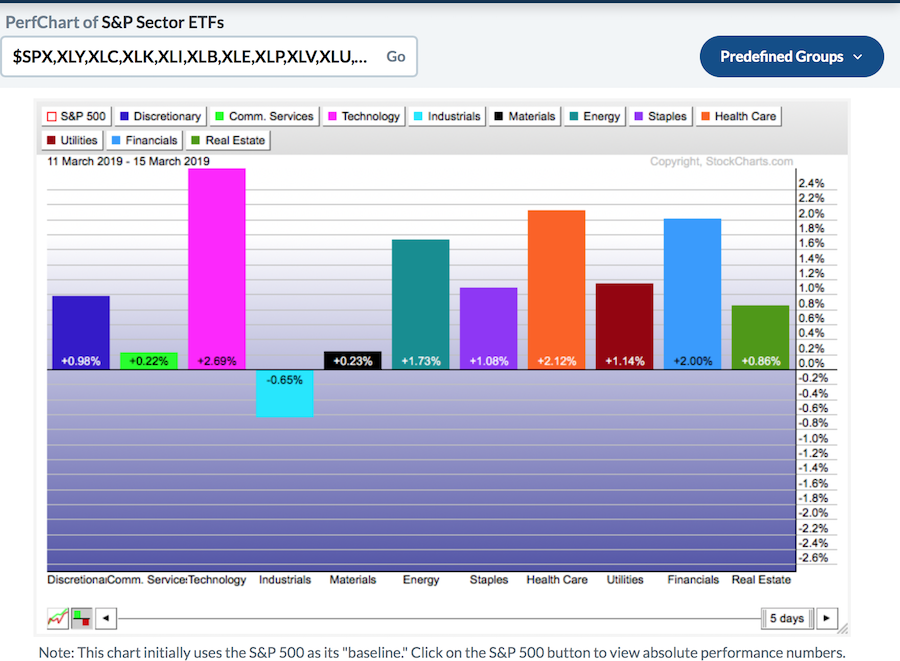
This week, the US Dollar lost 1.5 cents after making a new high last week. This resulted in most commodities turning up on the week. For sector movers, Technology stocks continue to be bought, while Utilities and other defensives performed well this week. That is a marked change from the performance off of the December lows. The chart below is for one week and is the absolute performance of each sector for the week.
 The chart below is the performance since the December 24th low on a relative basis compared to the $SPX. Typically, the sectors on the left are considered growth sectors. While those sectors were the big performers off of the lows, the past week saw a more focused move to some of the other sectors.
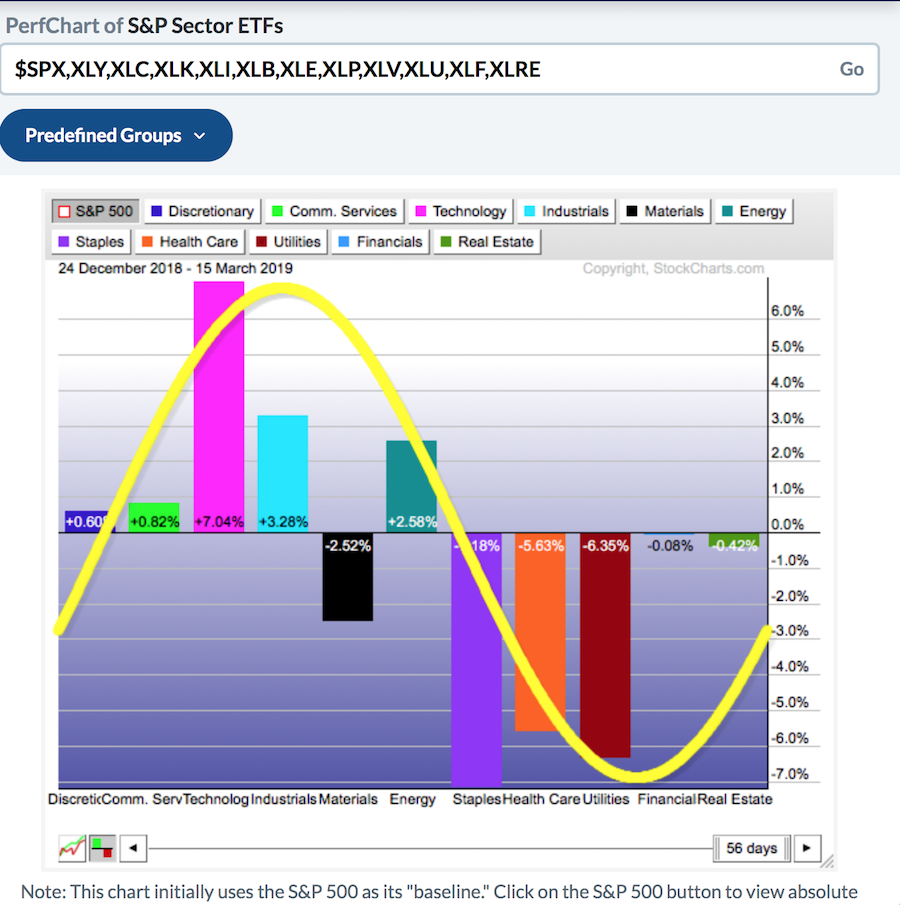 Technical Tip: By clicking on the $SPX button (in the top left of PerfCharts), you can change from absolute to relative performance. Compare the above two pictures and note the gray shading behind the $SPX on the relative performance.
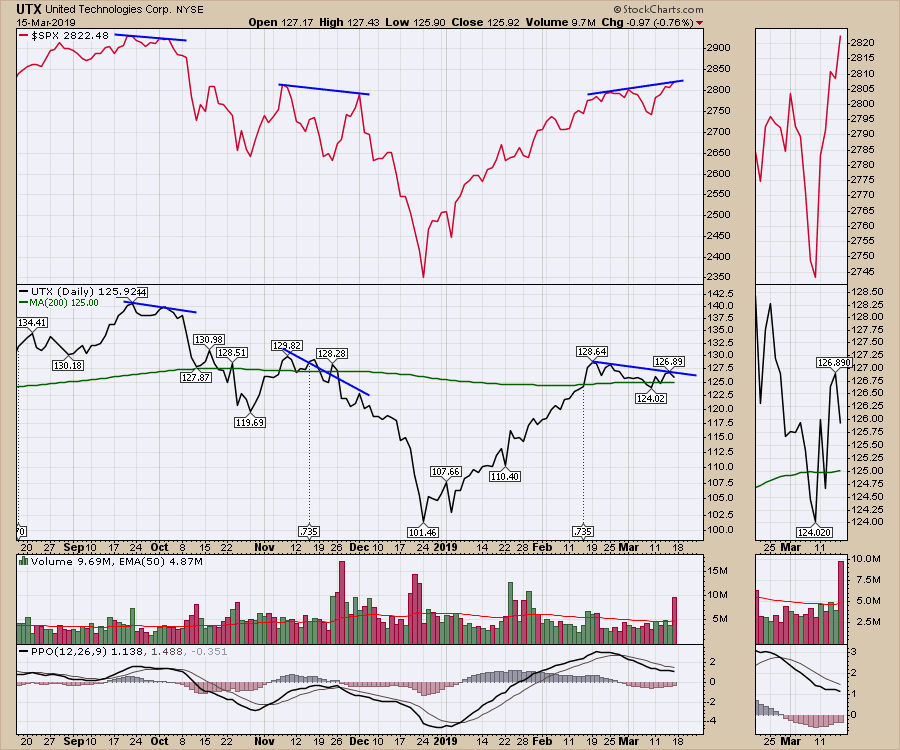
Well, it is not just the defensives perking up that is making me a little more inquisitive. On many of the charts, the industrials have been declining since the mid-February highs. While Boeing declined 10% this week, a significant number of the industrial charts have been pulling back for three or four weeks. An example of the typical chart profile is shown on UTX. United Technologies, which is in the Dow 30, is a very broad industrial company across a wide range of products. Notice the relative underperformance over the last four weeks.
 On this week's video, I rolled through the industrial companies, sorting them based on market cap. I think there is some compelling information to be found there. The industrial sector review is in the final 15 minutes of the video.
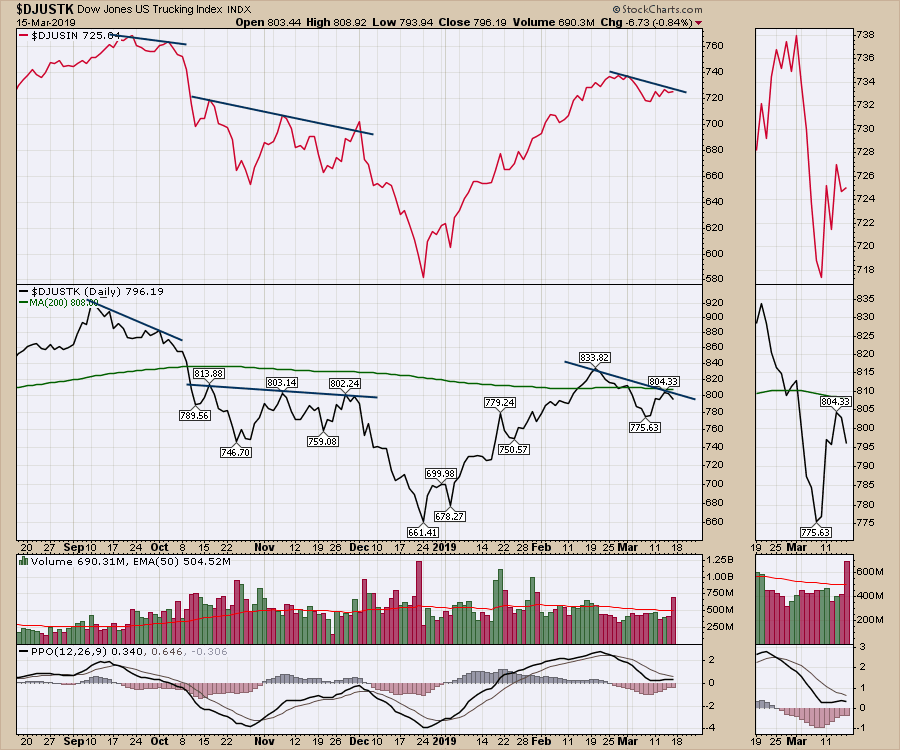
I also covered off the transports. While Boeing had a bad week and could drag down the general transport index, Boeing is not involved in Trucking. For Dow Theory, the concept is to compare the Transports to Industrials. When they are both behaving the same, this is confirmation of market direction. When they disagree, it tells us change may be coming.
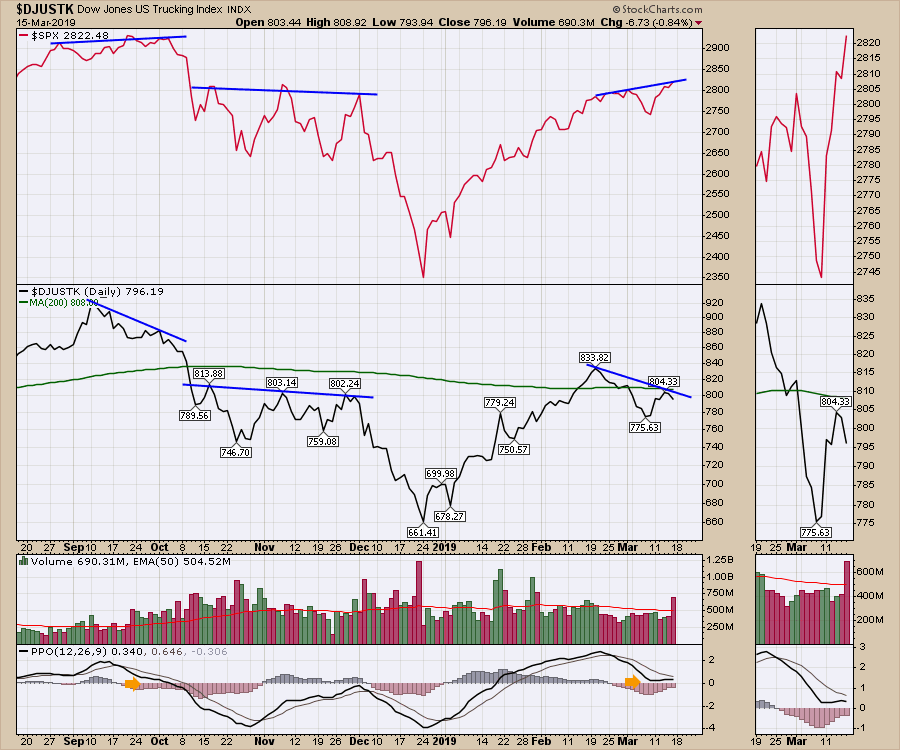
Let's start with the trucking index, with the $SPX on top. Momentum for the trucking index (shown by the PPO) is close to zero. With low momentum, caution is warranted, but the significant underperformance compared to the $SPX is even more concerning.
Next, let's compare the Industrials to the Trucking index. Here, we should see confirmation of direction, whereas the $SPX above can power higher on technology or other areas of the market. The Dow Theory is that the economy moves as goods produced (industrials) are moved (trucking and rail). Watching these two areas gives you a good guide to a big part of the economy. On the chart below, both trucking and industrials are pulling back and the $SPX is still pointed higher. If nothing else, it slaps a big caution button on my desk.
 Wabash is a large trailer manufacturer for transportation. The chart linked here shows some significant weakness. If the trucking business is starting to improve, truckers are the first to feel the increase in goods flow and will start to order new trucks and trailers. The Wabash chart suggests that that is not in sight.
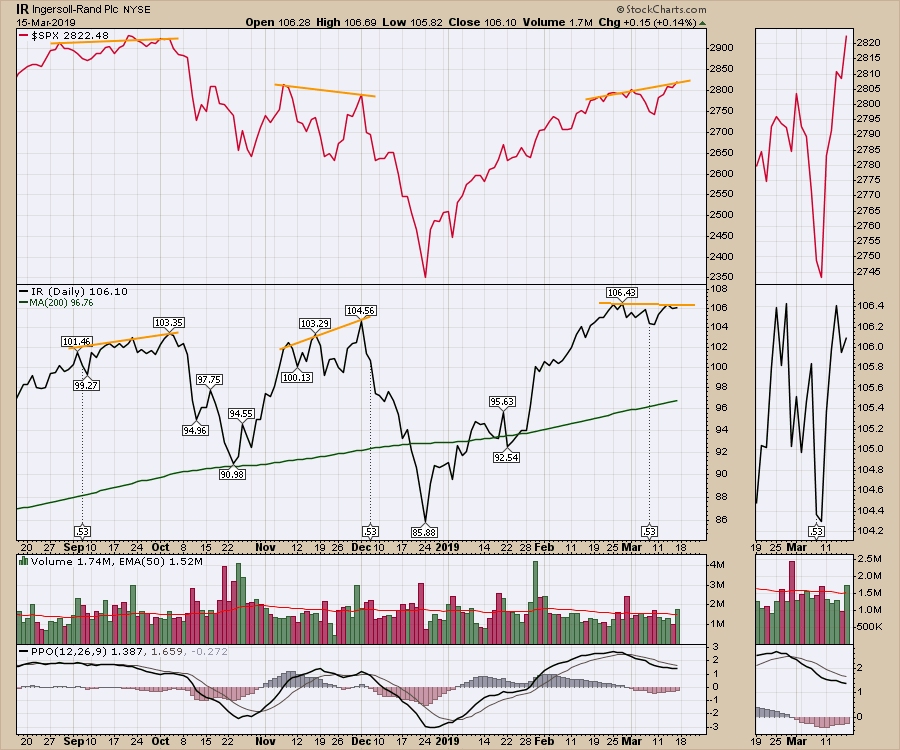
Ingersoll Rand is another big industrial company. This chart looks better than most, so I wanted to show it here, but it has struggled to break out to higher ground since the first push on February 25th. On the preceding rallies in September and November, IR outperformed the $SPX, giving no clues to potential weakness. Now, however, IR has started to underperform over the past three weeks. One day is not a trend reversal, but one month can be. This is one of the stronger charts and IR makes Thermo King refrigeration for transportation. The performance of this transportation division is not shown on a company chart. It would only take a few good days for IR to catch up to the slope of the $SPX line. The point is that this is one of the best charts in the industrials and it might be starting to slip too. This chart is the exception in the industrials, but have a look on the video and decide if you see the weakness across the charts that I see.
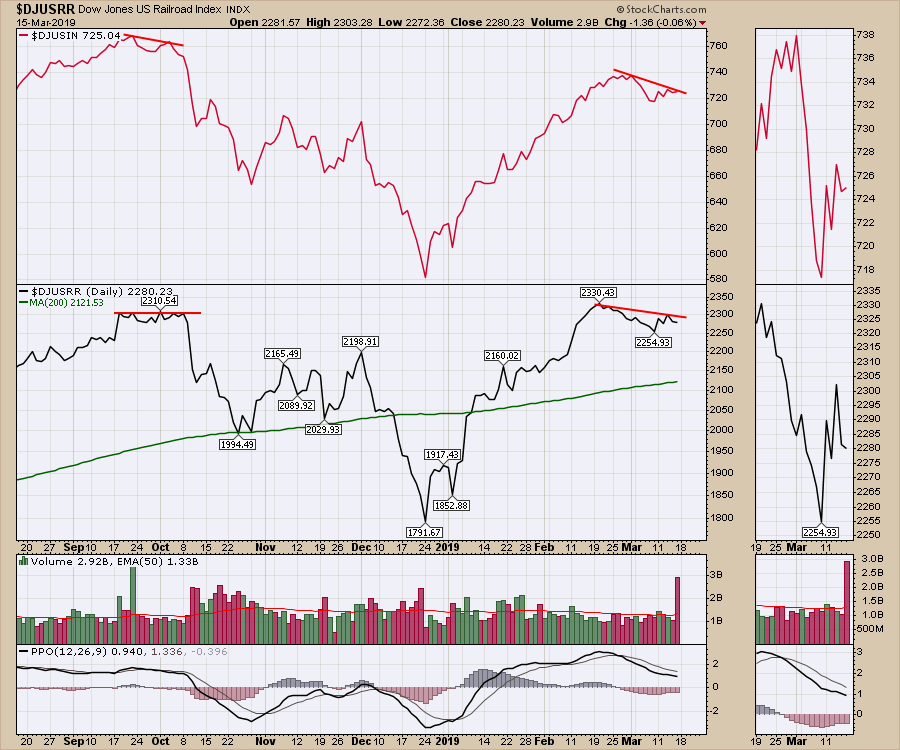
I also think the railway index is a much better economic indicator than trucking. Rather than relying on trucking, I prefer to watch both. A month ago, the railway index in the center panel was trying to break out to new highs. That index has been unable to break and hold above the September highs. Whenever a chart tests a prior high, you want to watch and see if the market holds the breakout. The staggering volume Friday on the railroad index is because of the Options Expiration, but it also had this sort of massive volume on the highs back in September as well. I have a low comfort level if railways are going to underperform the $SPX.
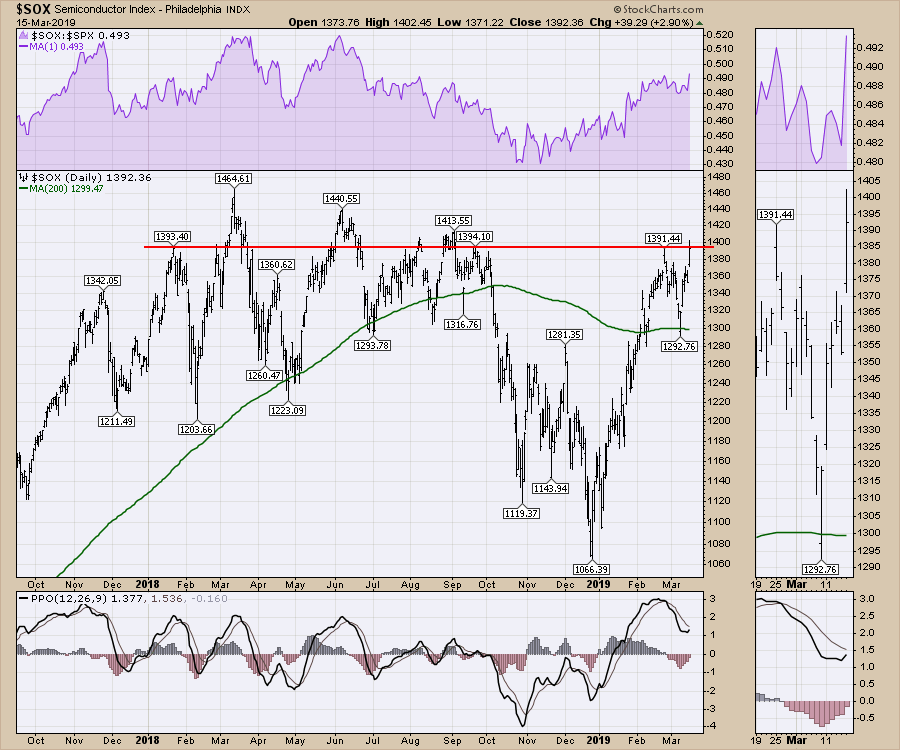
 One chart that improved markedly this week is the Semiconductor index, which is back up to the September 2018 level, though it will still have to work to reach to the spring highs. Nvidia had a big up week on the back of some acquisition news; I will be very interested to see where this chart is on Friday.
 There is a lot more information on the bonds on the weekly market review video below.
Here is a link to this week's Weekly Market Roundup, with a lot more information on the transports and the industrials.

Wednesday's Market Buzz talked about the bank stocks. Click on the Market Buzz below to watch.
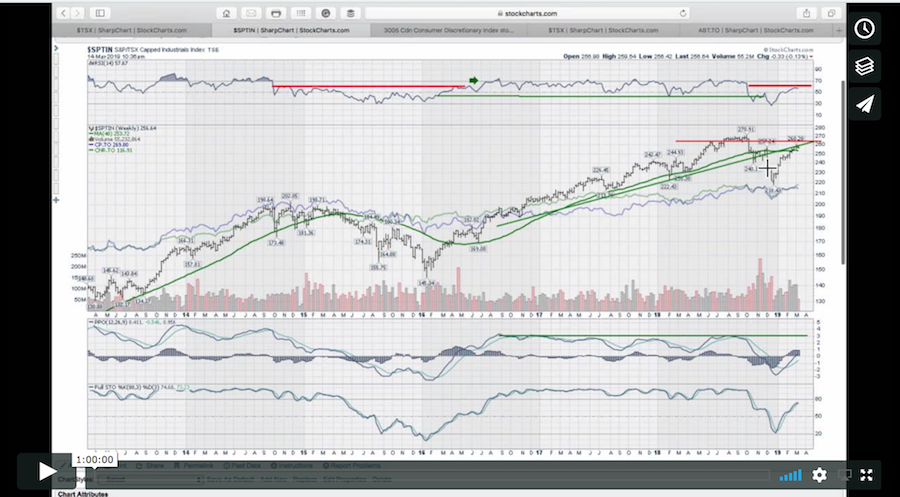
 Here is the the Canadian Market Roundup for mid-March.
If you would like to learn more about the basics of charting, check out Stock Charts for Dummies. The first section of the book walks through all the chart settings you need to help you get the charts you want, the second section explores why you might use charts for investing and the third section is about putting it all together.
Click here to buy your copy of Stock Charts For Dummies today!
If you are missing intermarket signals in the market, follow me on Twitter and check out my Vimeo Channel. Bookmark it for easy access!
Good trading,
Greg Schnell, CMT, MFTA
Senior Technical Analyst, StockCharts.com
Author, Stock Charts for Dummies
Hey, have you followed Greg on Twitter? Click the bird in the box below!
Want to read more from Greg? Be sure to follow his StockCharts blog:
The Canadian Technician
Good trading,
Greg Schnell, CMT, MFTA
