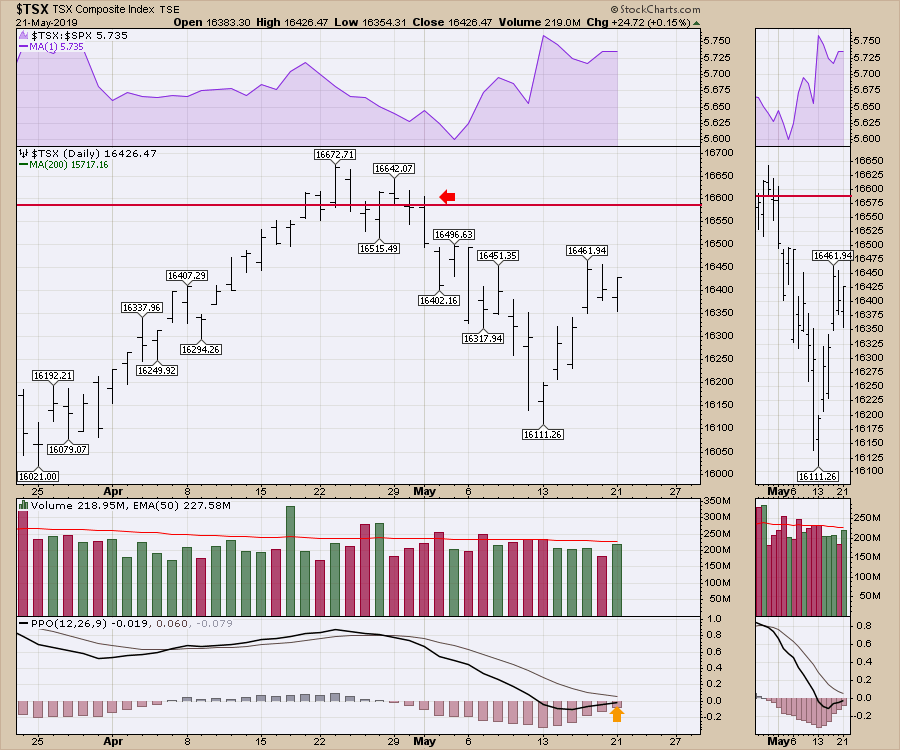
Following its high on April 23 (just a few days after Options Expiration), the Canadian market endured a failed breakout. A month later, the market is still below the breakout level. The Canadian index chart looks a little bit stronger, as two pieces of good news - the surge in Westjet on buyout news and a surge in Air Transat on a proposed buyout by Air Canada - helped to bounce a flat market and push it higher last week. As the market consolidates here, the momentum shown on the PPO is near zero. This will mark a pivotal spot if we can't rally back above the breakout level shortly.
 Unfortunately, taking a look at the sectors, we can see that Canada's three largest sectors all have negative performance for the month. Financials, Energy and Materials are weak. With Consumer Discretionary also being down, this all adds up to a bigger problem.
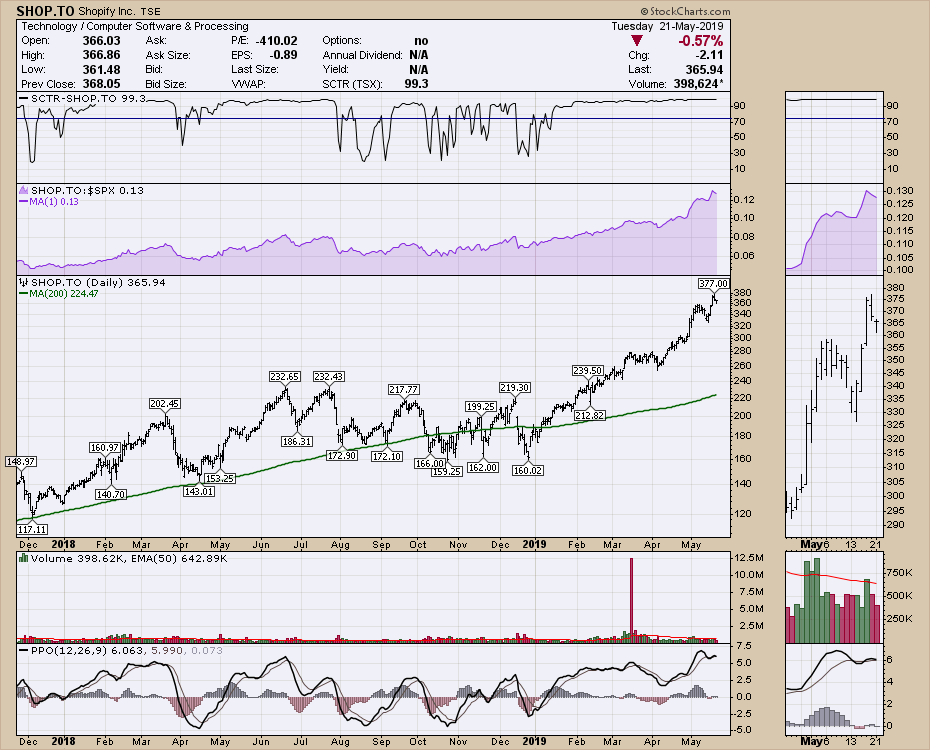
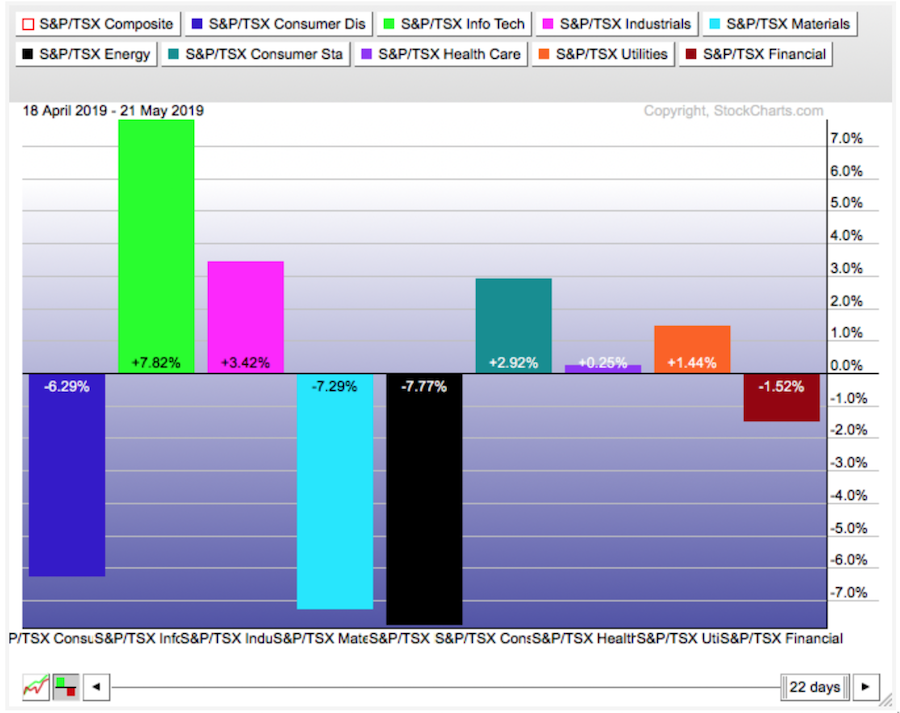 On the bright side, the technology group is soaring on the back of Shopify. The railroads are also near the top of their charts, which is helpful.
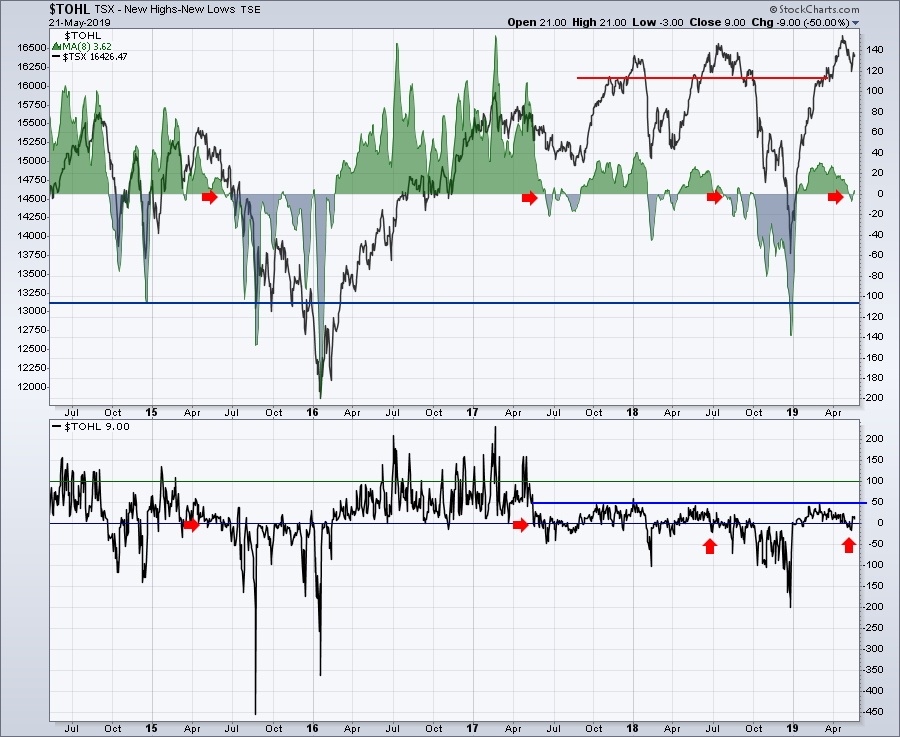
 With the Advance-Decline lines waning and the Net New Highs dipping below zero, the market could easily slip into a larger correction. The middle panel in the image below shows a moving average represented as an area chart. After the big pullback, this could be an important inflection point. The lower panel illustrates the daily movement by adding the daily result onto that of the previous day. The large divergence (much lower level on the advance/decline) between the two price peaks of July and April is significant. It is easy to draw the lines in hindsight of where the peaks are. As an example, the February 2015 peaks could have been used until the final high in April 2015 at a slightly higher high. A break back above would be bullish and likely lead to a strong move in one of the major Canadian sectors mentioned.
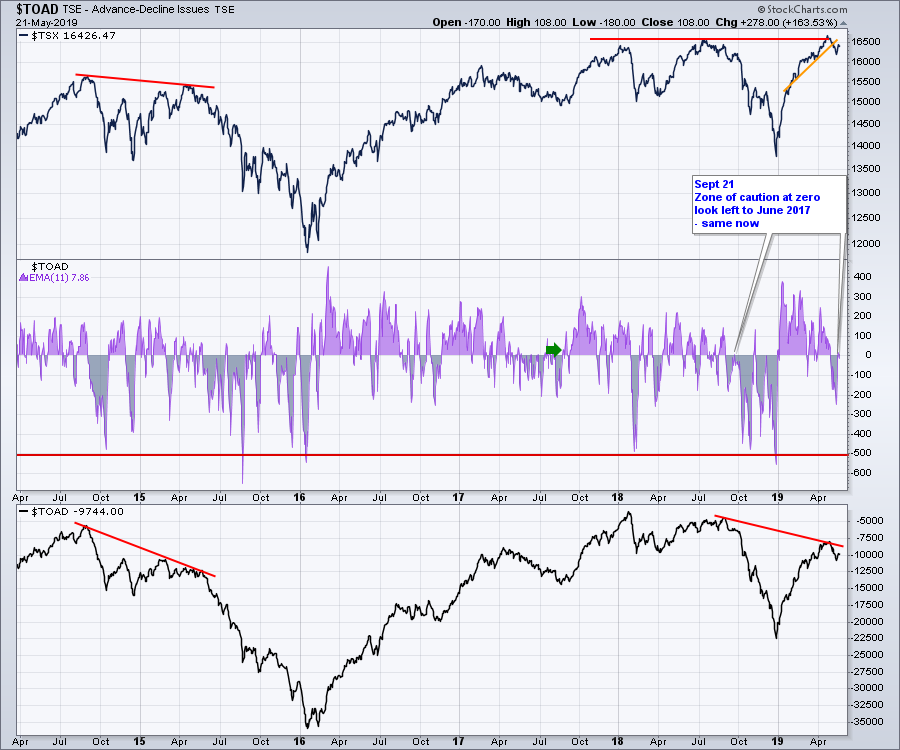 The Net New Highs indicator also shows more new lows than new highs, so the market is at best evenly balanced here. Past examples suggest a bias to a downside move. The January 2018 move down could have also been marked on the chart, but, instead of waffling around the zero line on the bottom panel, it plummeted. That one was obvious!
 Here is the link to the new Canadian Technician video, where I provide a lot more coverage on topics including bond yields, Gold and Oil. In addition, I also worked through strong SCTR rankings and where to find them.

Good trading,
Greg Schnell, CMT, MFTA
Senior Technical Analyst, StockCharts.com
Author, Stock Charts For Dummies
Want to stay on top of the market's latest intermarket signals?
– Follow @SchnellInvestor on Twitter
– Connect with Greg on LinkedIn
– Subscribe to The Canadian Technician
