ChartWatchers June 19, 2004 at 10:05 PM
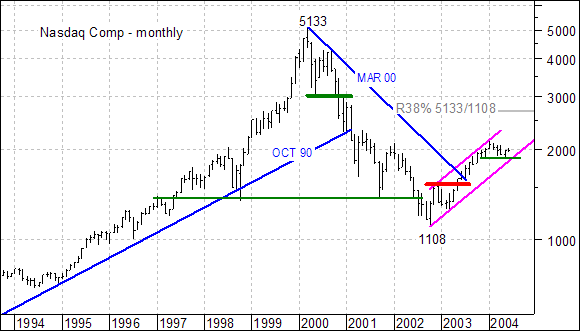
The advance since October 2002 is certainly impressive on its own merits, but pales when compared to the prior decline. The advance has not even retraced 38% of this decline and formed a rising price channel... Read More
ChartWatchers June 19, 2004 at 10:04 PM

I'm very pleased to announce that we now have a chart showing the S&P 600 Small-Cap stocks above their 200-EMA, 50-EMA, and 20-EMA. But wait! There's more! We also have this chart for the S&P 400 Mid-Cap, S&P 500, Nasdaq, Nasdaq 100, S&P 100, and NYSE Composite... Read More
ChartWatchers June 19, 2004 at 10:03 PM
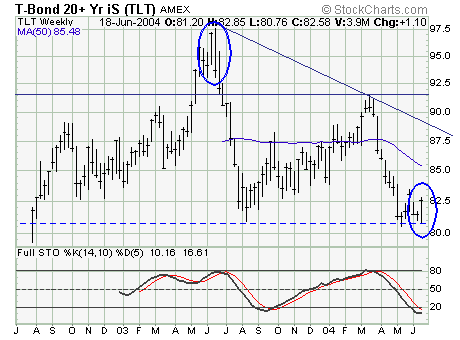
From a fundamental perspective...the past several months shows US interest rates to have risen very sharply as US economic data continues to show strength - from employment to manufacturing to retail sales et al... Read More
ChartWatchers June 19, 2004 at 10:01 PM

During the two years prior to 2004, a falling U.S. dollar pushed commodity prices to the highest level in more than a decade. During the first half of this year, a rebound in the dollar has coincided with a downside correction in commodities. That may be changing... Read More
ChartWatchers June 19, 2004 at 10:00 PM
Stocks moved sideways last week with most of the major averages finishing within 1% of where they started. The Amex was the big "winner" - up 1.7% - while the Nasdaq lost 0.6% and everyone else finished up somewhere in between... Read More
ChartWatchers June 06, 2004 at 10:05 PM

There are two distinct advances and two declines on the weekly Nasdaq Composite chart with the fifth wave still to come. The first advance started in October 2002 and ended in December 2002 to form Wave 1... Read More
ChartWatchers June 06, 2004 at 10:04 PM
In the week ended May 15, 2004 NYSE Member Net Buy/Sell numbers hit a new, all-time high of net buying of +741,439,000 shares... Read More
ChartWatchers June 06, 2004 at 10:03 PM
Over the past two week's, sentiment has gone from "highly bearish" to "highly bullish" - a change in circumstances that shows confusion above all, but the fact remains the current rally in the major indices has reached the important 50%-60% retracement levels typical of countertr... Read More
ChartWatchers June 06, 2004 at 10:02 PM

NEW BOOKSTORE DESIGN - We're very pleased with how our bookstore redesign project turned out and we think you will be too. Check out the new look and features of StockChartsBookStore... Read More
ChartWatchers June 06, 2004 at 10:01 PM

One of the principles of intermarket behavior is that commodity-related stocks usually peak before the commodity. That's why the next chart is so interesting. While energy prices hit a record high early this week, the Energy Select Sector SPDR peaked in late April... Read More
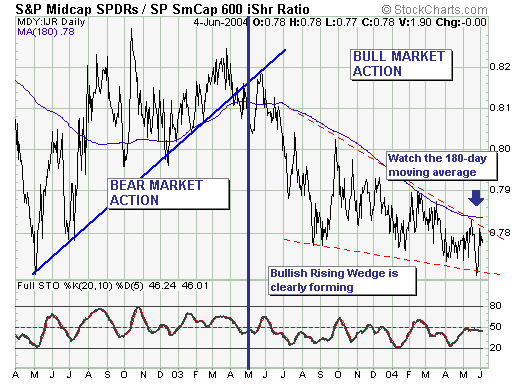
ChartWatchers June 06, 2004 at 10:00 PM
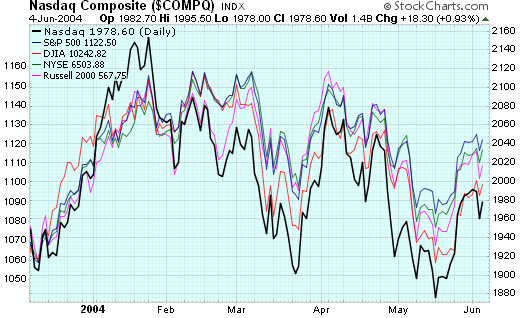
Last week saw the major markets put in another "lower high" for the current downtrend - the third major one since things started moving lower back in March... Read More