ChartWatchers January 22, 2005 at 11:05 PM
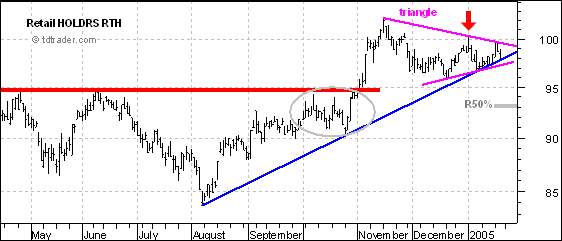
January and 2005 have not been good for the bulls. After a strong finish in 2004, stocks were hit with strong selling pressure to begin the year and have yet to recover. A look into November and December reveals early weakness in two key groups... Read More
ChartWatchers January 22, 2005 at 11:04 PM
The Equity and OEX Put/Call Ratios generally signal overbought and oversold conditions that help identify price tops and bottoms; however, sometimes the OEX Put/Call Ratio will invert relative to the Equity Put/Call Ratio... Read More
ChartWatchers January 22, 2005 at 11:03 PM
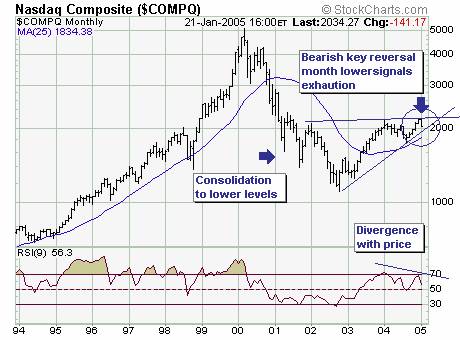
The January decline to date is gaining in importance; if prices remain at current to lower levels through the next six trading sessions then a bearish key reversal month' will form... Read More
ChartWatchers January 22, 2005 at 11:02 PM
THE BUILD OUT CONTINUES - In 2004, StockCharts.com spent over $750,000 on improving our technology infrastructure - things like servers, routers, switches, data, and all the things it takes to get you the best charts on the web as quickly as possible. We're not done yet however... Read More
ChartWatchers January 22, 2005 at 11:01 PM
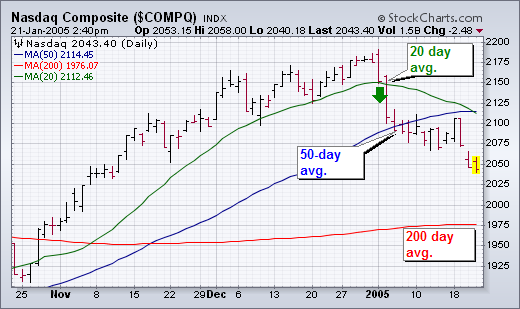
The 20-day average is usually too short for my purposes which is to spot bigger trend changes (although it is the period used in Bollinger Bands). At the same time, the 200-day average is too long... Read More
ChartWatchers January 22, 2005 at 11:00 PM
The market finished last week with three big down days. So far this year, the Nasdaq is down 6.5%. Much of the fall has been driven by Small Cap stocks as the S&P 500 Large Caps is only down 3.6% during the same period... Read More
ChartWatchers January 08, 2005 at 11:05 PM
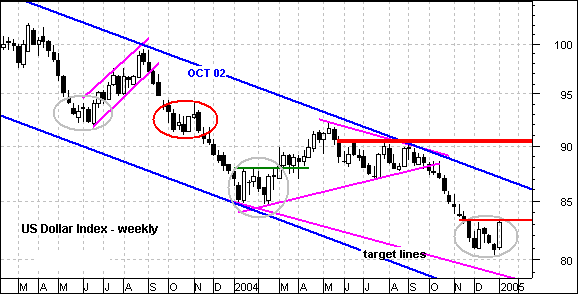
The Dollar may be giving us something to talk about.... and possibly even worthy of a short-term play. The US Dollar Index has consolidated for 4-5 weeks and formed long white candlesticks twice... Read More
ChartWatchers January 08, 2005 at 11:04 PM
There has been a lot of concern among analysts that sentiment has been too bullish; however, the recent correction has done a lot to alleviate that condition. The American Association of Individual Investors (AAII) performs an electronic sentiment poll every week... Read More
ChartWatchers January 08, 2005 at 11:03 PM
Last week's stock market correction was significant in our opinion; for the technical patterns suggest the correction will continue in the weeks ahead... Read More
ChartWatchers January 08, 2005 at 11:01 PM
The S&P 500 ended the week with a loss of nearly 30 points (-2.4%). According to the historical record since 1950, a down close during the first week of January by the S&P 500 has resulted in a down year 45% of the time... Read More
ChartWatchers January 08, 2005 at 11:00 PM
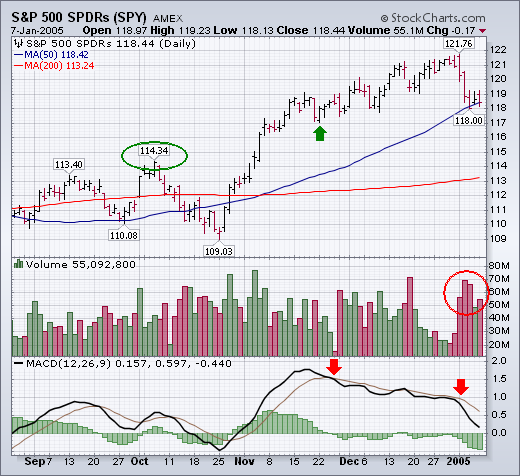
Our first issue of 2005 kicks off with a great summary of the recent S&P action by John Murphy. Richard Rhodes then looks at last week's correction. Carl Swenlin examines the recent change in investor sentiment and Arthur Hill wraps things up with a look at the US Dollar... Read More