ChartWatchers August 16, 2009 at 04:52 PM
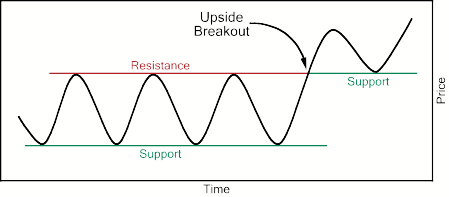
This is the next part of a series of articles about Technical Analysis from a new course we're developing. If you are new to charting, these articles will give you the "big picture" behind the charts on our site... Read More
ChartWatchers August 15, 2009 at 10:00 PM
John will return for our next issue..... Read More
ChartWatchers August 15, 2009 at 09:57 PM
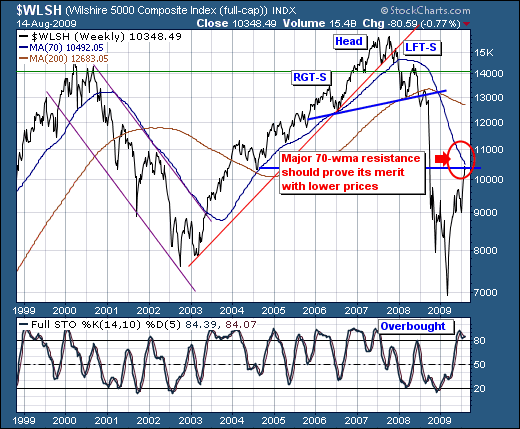
The July-August stock market rally has caught many surprised given its strength and duration; however, we are of the opinion that this "freight train" is running of out of fuel, and shall falter from roughly current levels in what may be quite a "quick and nasty" setback at a min... Read More
ChartWatchers August 15, 2009 at 09:41 PM
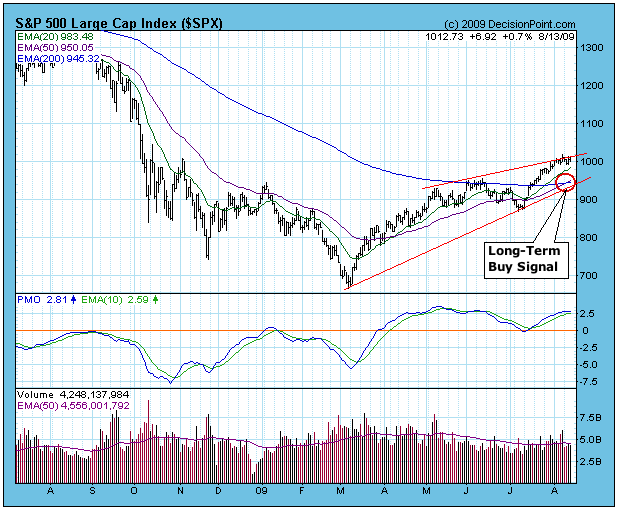
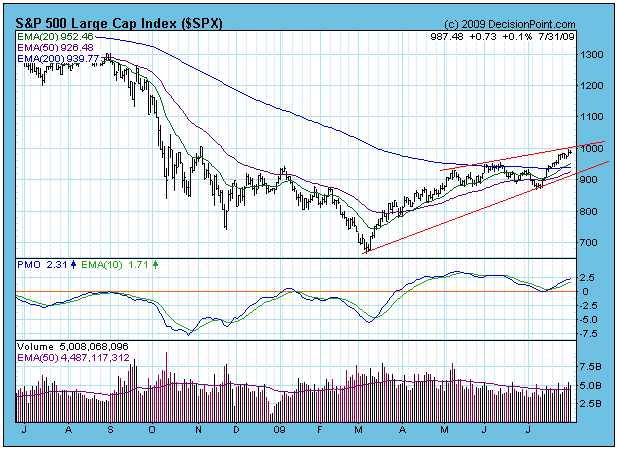
On Tuesday of this week our long-term model for the S&P 500 switched from a sell to a buy signal. While it is a simple model -- the signals are generated by the 50-EMA crossing over the 200-EMA -- it can also be very effective, capturing a gain of 28... Read More
ChartWatchers August 15, 2009 at 09:35 PM
Two weeks ago, I pointed out what appeared to be the early stages of a new trend of outperformance by the financials and suggested they might be primed for a move higher to rescue the stumbling stock market... Read More
ChartWatchers August 14, 2009 at 04:00 PM
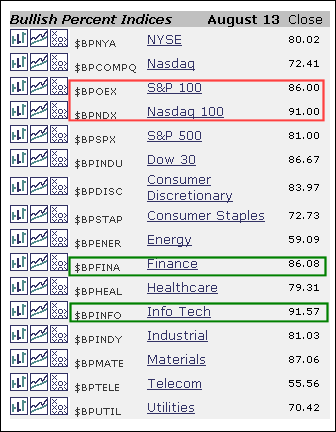
The Bullish Percent Indices measure the percentage of stocks on a Point&Figure buy signal for a given index. In general, an index has a bullish bias when its Bullish Percent is above 50% and a bearish bias when below 50%. Stockcharts... Read More
ChartWatchers August 02, 2009 at 03:05 AM
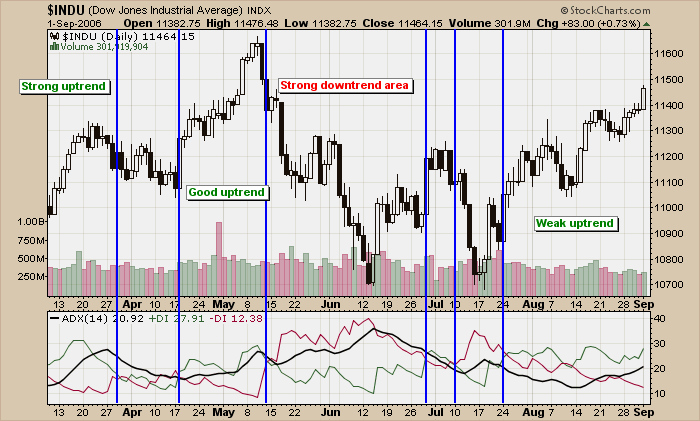
Hello Fellow ChartWatchers, Here's an article that first appeared in 2006 about using the ADX indicator. With lots of stocks starting to trend upwards now, I thought it was a good time to revisit this topic... Read More
ChartWatchers August 01, 2009 at 10:40 PM
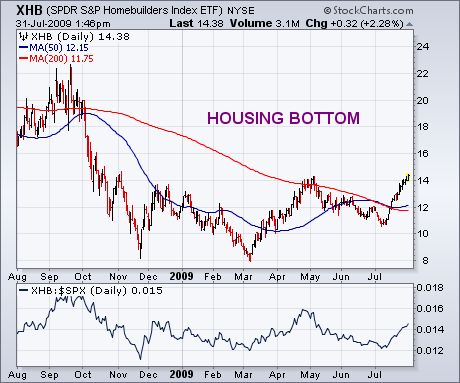
On Monday, I wrote a bullish message on the homebuilding group and suggested using the SPDR S&P Homebuilding ETF (XHB) as one way to participate in the housing recovery... Read More
ChartWatchers August 01, 2009 at 10:36 PM
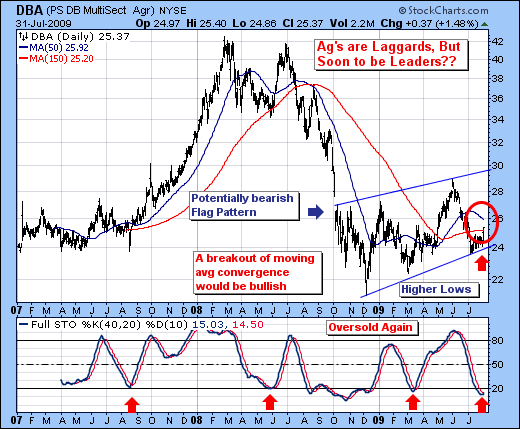
On Thursday and Friday of last week, we saw the US dollar resume its downtrend, and the commodity sector begin to pick up participation as a result... Read More
ChartWatchers August 01, 2009 at 10:23 PM
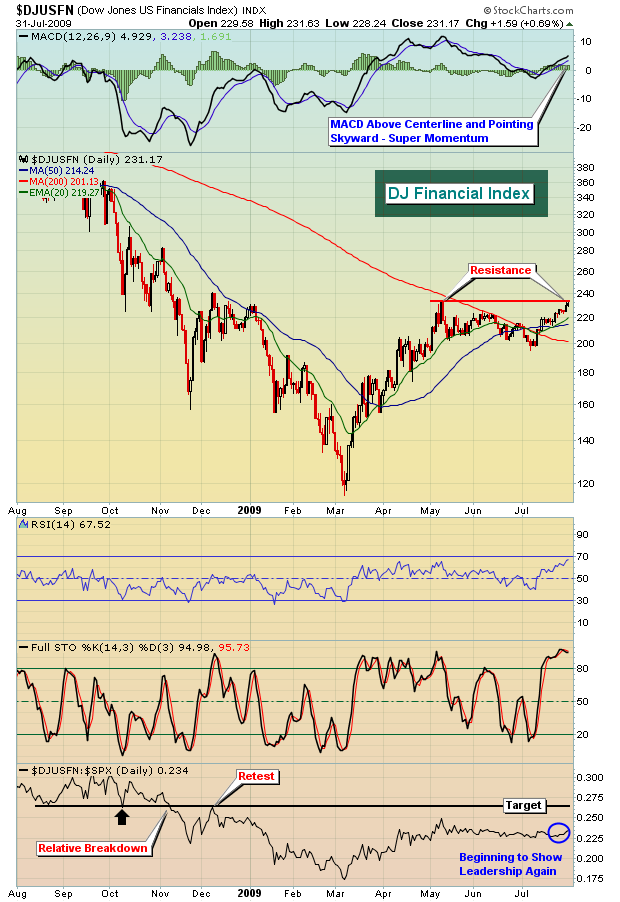
During the initial phase of the market recovery, from the March lows to the early May highs, financials were a primary driver of the move... Read More
ChartWatchers August 01, 2009 at 10:18 PM
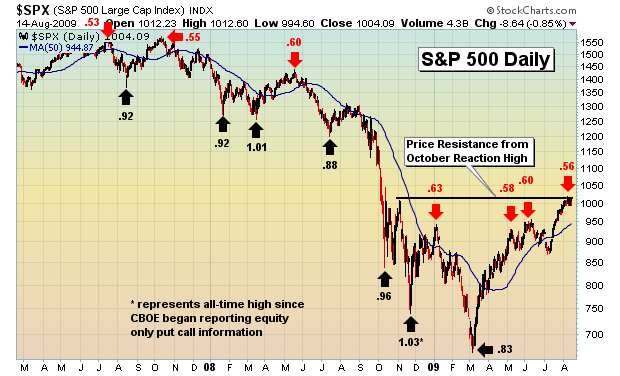
Since the price lows of early-July, the market has moved relentlessly higher, penetrating the important resistance posed by the 200-EMA. When this rally began, a narrow window of fairly low-risk opportunity was presented... Read More