ChartWatchers March 18, 2012 at 01:41 AM
Hello Fellow ChartWatchers! The new version of our Public ChartList area is now officially released and ready for your use... Read More
ChartWatchers March 17, 2012 at 11:22 PM
OVER 800 ARTICLES AND COUNTING! The StockCharts Answer Network (s.c.a.n.) passed another milestone last week with its 800th question getting answered. If you haven't visited it yet, s.c.a.n... Read More
ChartWatchers March 17, 2012 at 05:16 PM
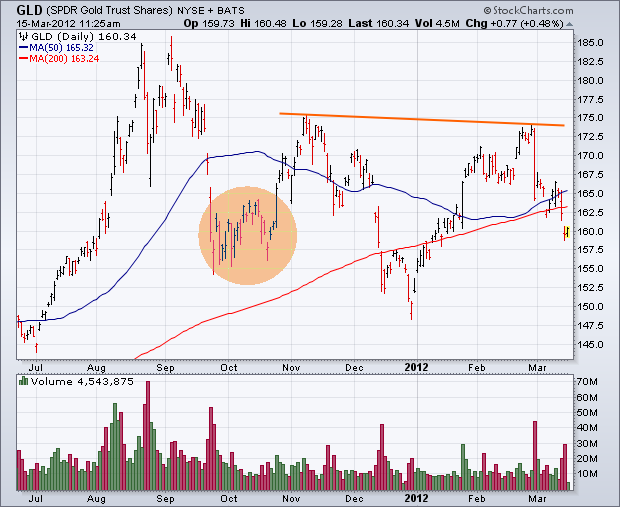
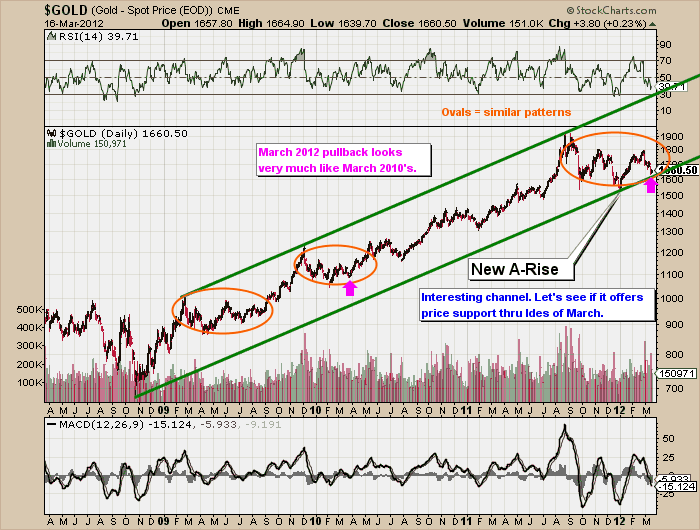
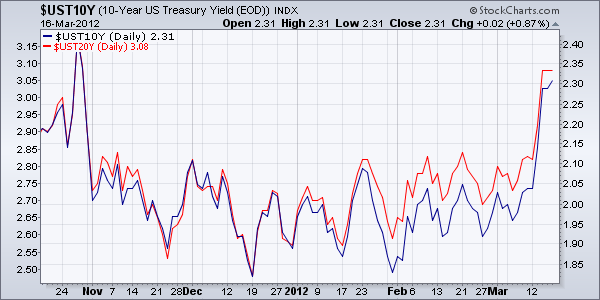
A couple of weeks ago (February 28) I wrote a positive article on precious metal assets. The entire group has taken a big hit since then. Two contributing factors have been more positive comments from the Fed, which imply little or no more quantitative easing. That pushed U.S... Read More
ChartWatchers March 17, 2012 at 04:41 PM
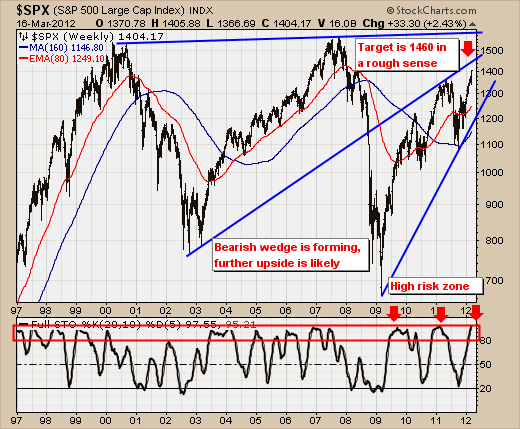
The S&P 500 rally continues unabated, although it has shown some signs of wear and tear given the less-than-hoped for volume patterns as well as advance/decline patterns... Read More
ChartWatchers March 17, 2012 at 04:37 PM
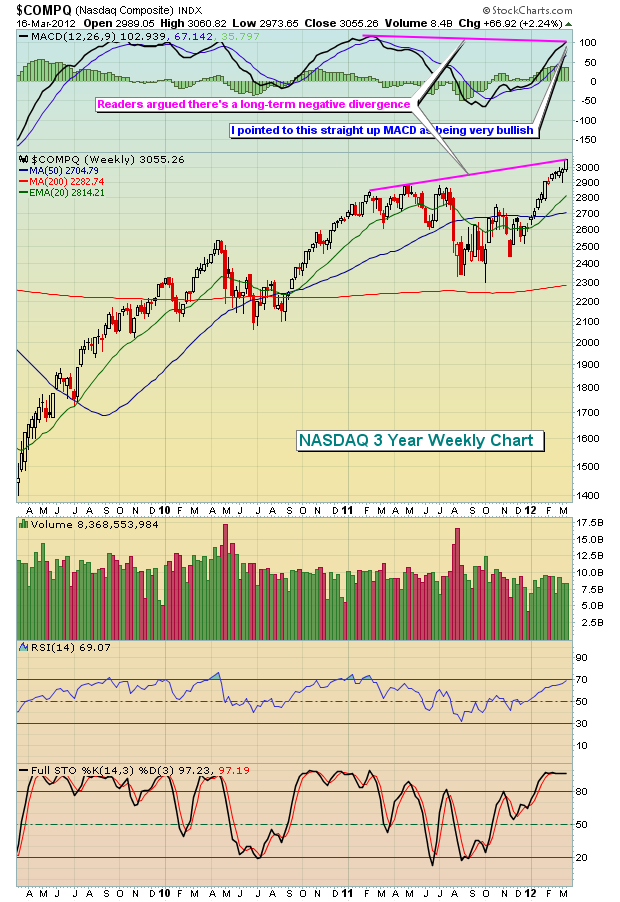
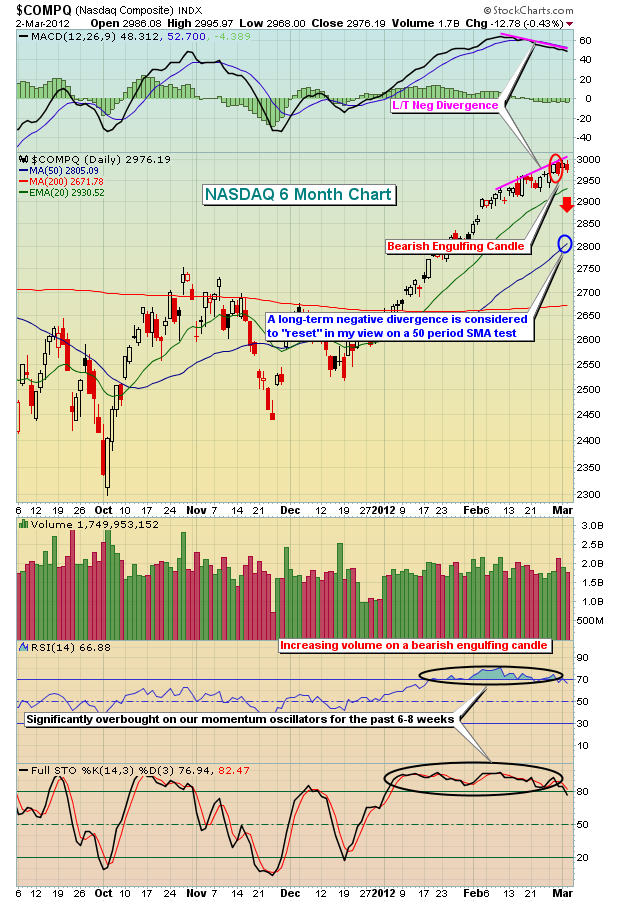
In my last article, I featured a weekly NASDAQ chart and pointed out that the MACD was coming up off the centerline and pointing higher... Read More
ChartWatchers March 17, 2012 at 04:33 PM
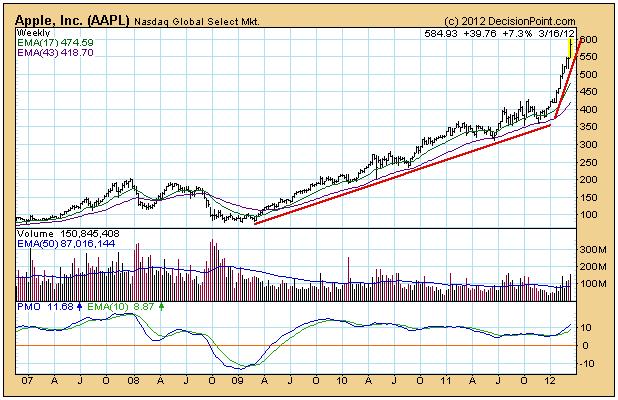
Apple is a great company, and AAPL has been a great stock since early-2009. From that point to the end of 2011 it rose +300% in an orderly, relentless advance. The angle of the rising trend line was conservative and sustainable... Read More
ChartWatchers March 17, 2012 at 02:31 PM
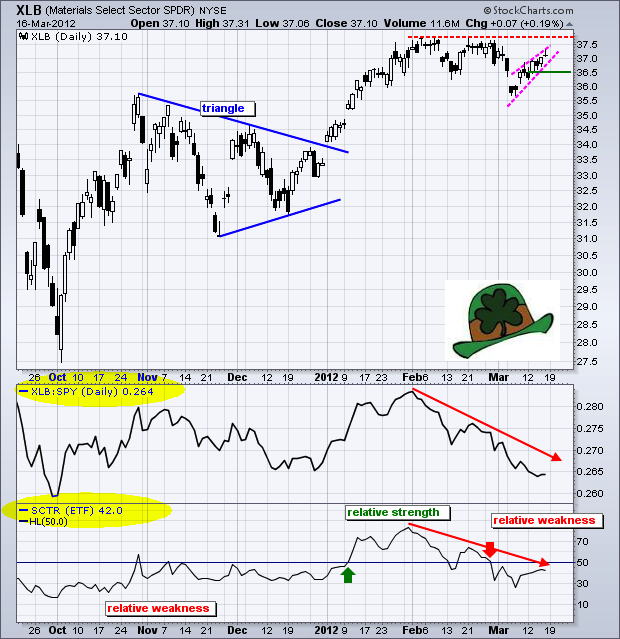
While the S&P 500 and Dow moved to new highs last week, the Materials SPDR (XLB) fell short of its February highs and continues to underperform. Also note that the Technology SPDR (XLK) and Consumer Discretional SPDR moved to new 52-week highs last week... Read More
ChartWatchers March 05, 2012 at 02:33 AM
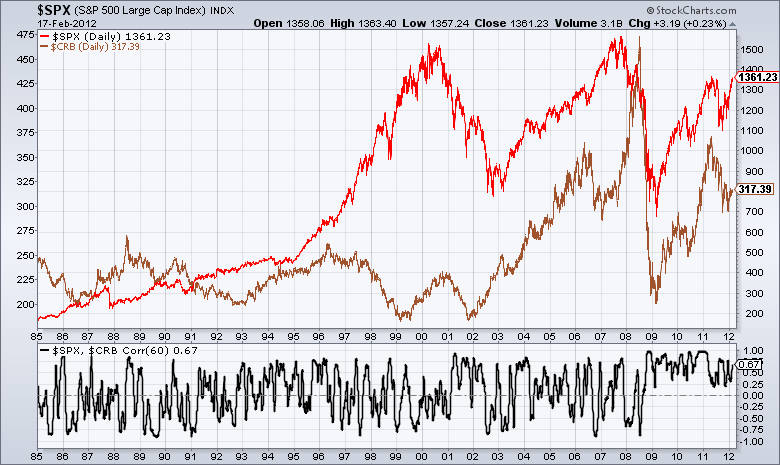
Hello Fellow ChartWatchers! In my last article, I went over two key Intermarket relationships - the one between the US Dollar and Commodities and the one between Commodities and the US Stock Market... Read More
ChartWatchers March 03, 2012 at 09:15 PM
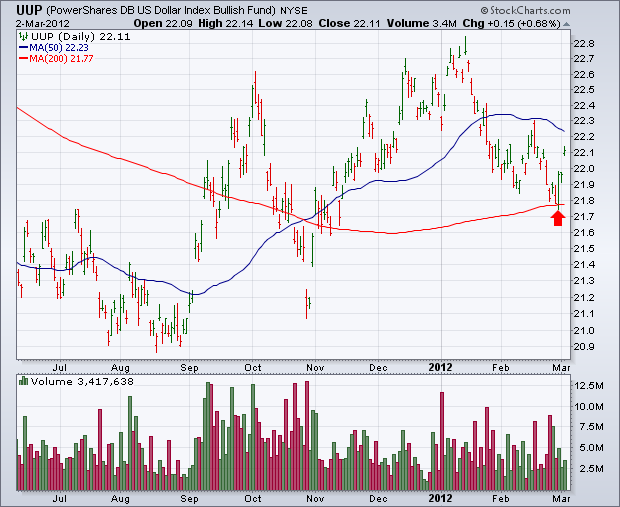
An impressive upside reversal day on Wednesday enabled the Power Shares US Dollar Index (UUP) to bounce off its 200-day moving average as shown in Chart 1 (see arrow). That dollar turnaround was apparently the result of Mr... Read More
ChartWatchers March 03, 2012 at 09:05 PM
In earlier articles, I wrote about key upcoming resistance on banks and the "January Effect". Very strong performance in January suggests that equities will continue to rally throughout 2012... Read More
ChartWatchers March 03, 2012 at 08:57 PM
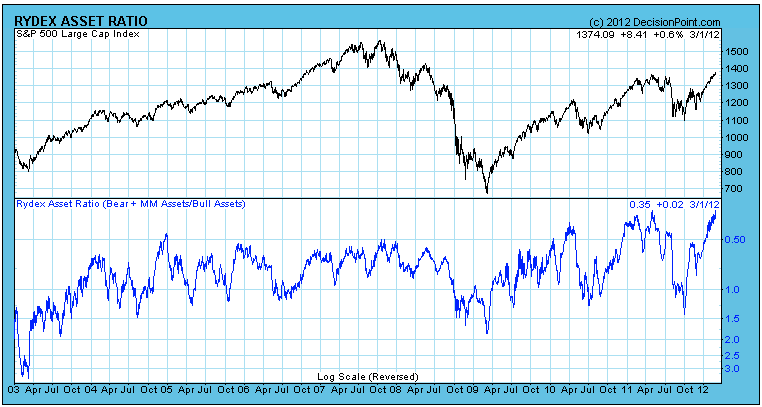
At Decision Point we keep a close watch on asset levels in the Rydex mutual fund group as a way of evaluating investor sentiment... Read More
ChartWatchers March 03, 2012 at 12:14 PM
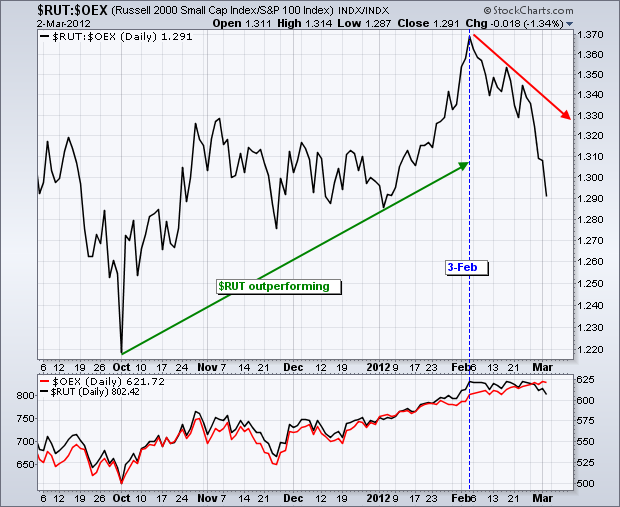
Relative weakness in small-caps remains a concern for the broader market. Smaller companies are less diversified and have less exposure abroad, which makes them more vulnerable to changes in the domestic economy... Read More