ChartWatchers July 20, 2013 at 03:31 PM
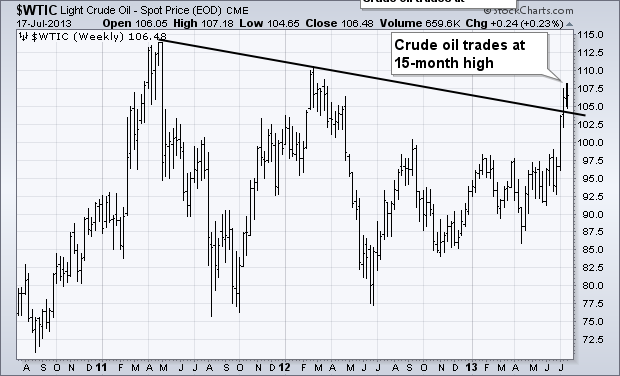
Chart 1 shows Light Crude Oil trading at the highest level in fifteen months. My July 5 message showed crude oil trading higher in an attempt to close the gap between it and higher priced brent crude. As of today, crude is only a dollar away from its European counterpart... Read More
ChartWatchers July 20, 2013 at 03:20 PM
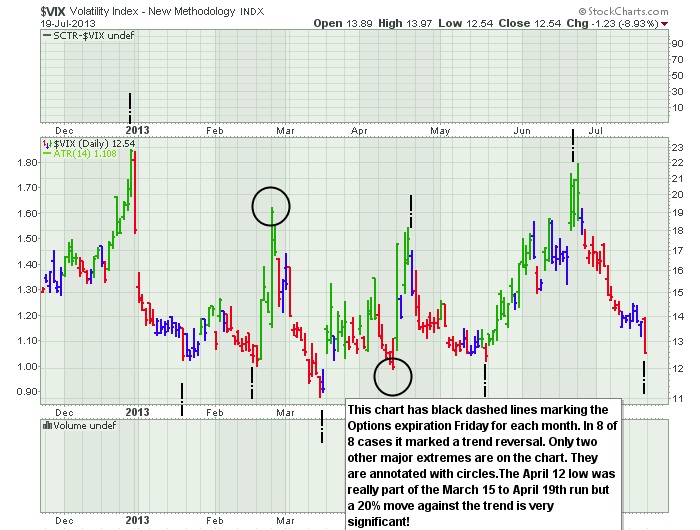
Notice the price action on the $VIX. The peaks and valleys are 100% apart! The monthly options expiration date has marked a significant turning point for the $VIX every month for at least 8 months. I have marked the OE day with a black dashed line... Read More
ChartWatchers July 20, 2013 at 03:11 PM
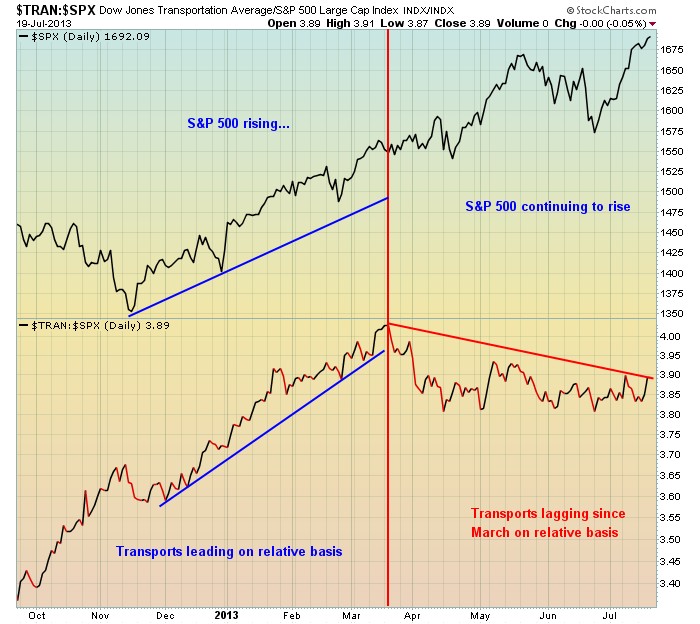
Transportation stocks helped lead the market rally from October 2012 through March 2013, but since that time it's been a struggle on a relative basis. Check out this relative chart: Relative support resides near the 3... Read More
ChartWatchers July 20, 2013 at 01:49 PM
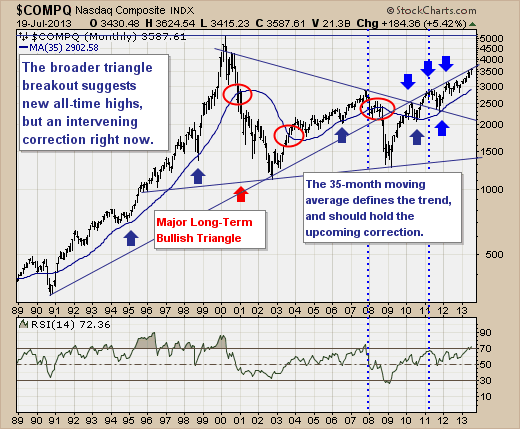
The NASDAQ Composite is a "forgotten index", as it led the tech bubble higher into the 2000 high. Now, it is the NASDAQ 100 that garners all the attention given it consists mainly of Apple (AAPL) and Google (GOOG)... Read More
ChartWatchers July 20, 2013 at 01:27 PM

DecisionPoint.com has a unique market indicator that measures very short-term participation of stocks in a given index... Read More
ChartWatchers July 20, 2013 at 11:38 AM
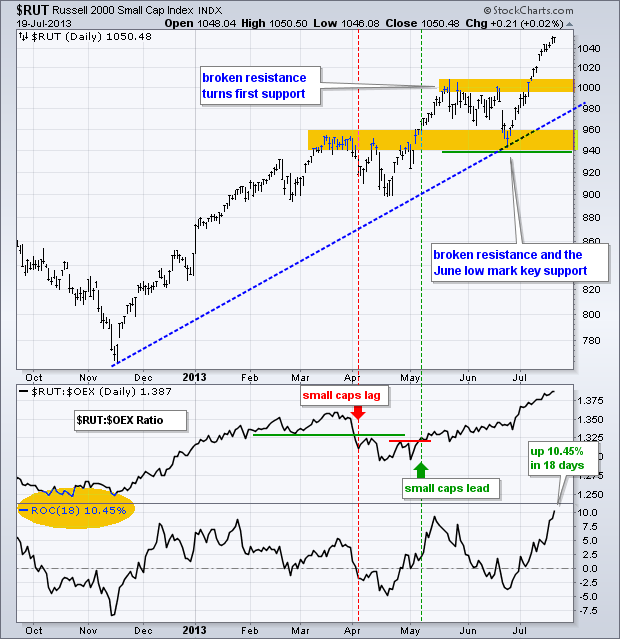
The Russell 2000 ($RUT) is leading the market higher with a breakout on July 8th and a series of 52-week highs the last two weeks. This key small-cap index was one of the first of the major indices to break above its May high... Read More
ChartWatchers July 20, 2013 at 06:31 AM
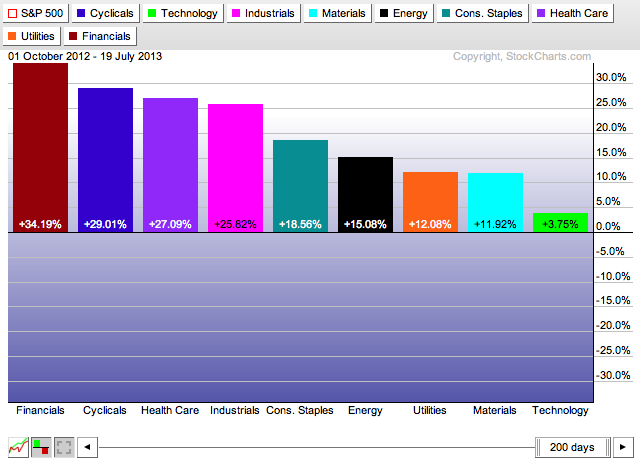
Hello Fellow ChartWatchers! In case you haven't noticed, the Financial sector has been dominating the market for over a year now with the Consumer Cyclicals not far behind. How do I know? I used our S&P Sector Performance chart... Read More
ChartWatchers July 06, 2013 at 08:39 PM
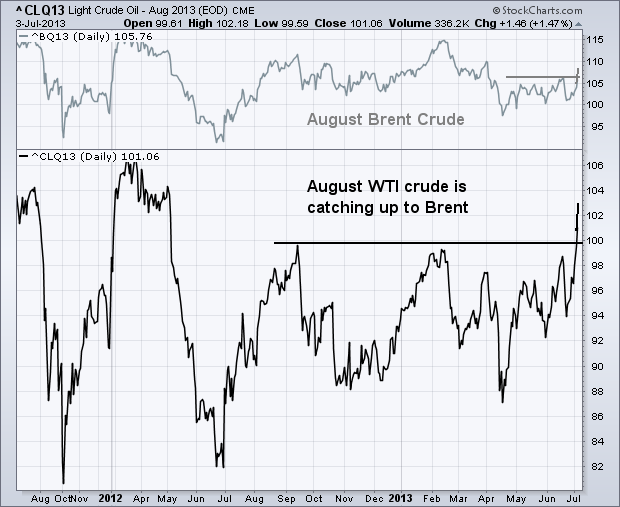
The price of West Texas Intermediate Crude oil (the U.S. benchmark) has exploded over the last week. The lower line in the chart below shows the August light crude oil contract having broken out to the highest level in 14 months. Today's rise puts August crude at 103... Read More
ChartWatchers July 06, 2013 at 04:44 PM
This past week, the monetary policy world shook once again as the Bank of England and the European Central Bank provided the markets with "dovish" comments regarding leaving o/n funding rates low "for an extended period of time... Read More
ChartWatchers July 06, 2013 at 04:37 PM
I noticed the British Pound took an absolute thumping this week. It moved almost 5 cents to the $USD. But more importantly, the USD has moved above the long term trend line. As the largest currency in the world, that would suggest money continues to move to the $USD... Read More
ChartWatchers July 06, 2013 at 04:00 PM
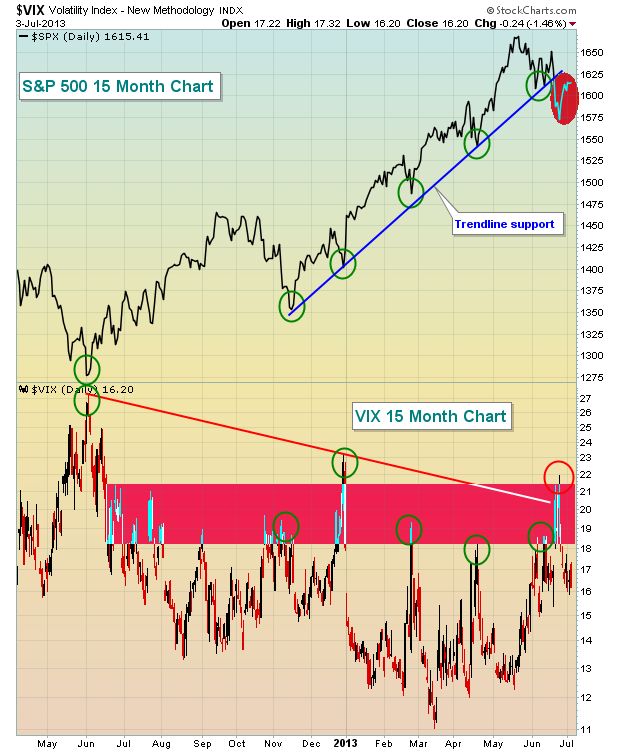
In the very near-term, it's difficult to predict which way the S&P 500 is heading. Recently, we saw the Volatility Index ($VIX) spike to nearly 22 and the multi-month uptrend line on the S&P 500 was violated... Read More
ChartWatchers July 05, 2013 at 10:11 PM
Hello Fellow ChartWatchers! The big news at the moment is the big move in bonds ($TNX is at highest point since mid-2011) and gold ($GOLD is at lowest point since mid-2010). Several of the other commentators will have more to say about those developments below... Read More
ChartWatchers July 05, 2013 at 09:03 PM
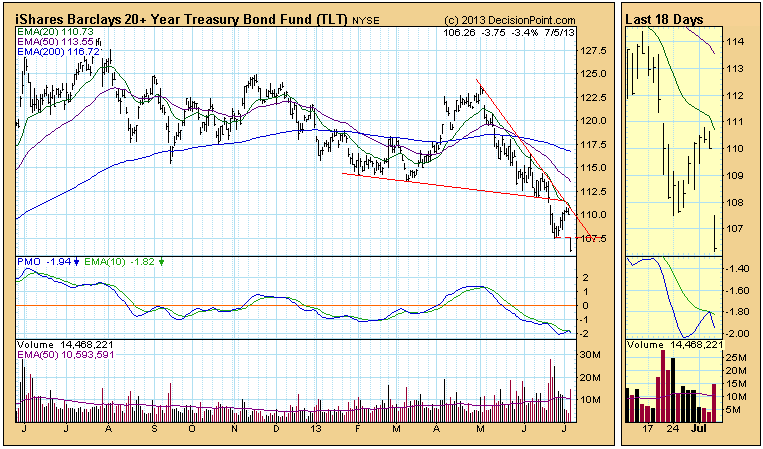
Last week TLT, our bond market surrogate, made a new low, then bounced up to the resistance of the declining tops line drawn from the May top. It turned down on Wednesday, we thought beginning a move to test the recent low, but today TLT didn't bother to retest the low... Read More
ChartWatchers July 05, 2013 at 12:21 PM
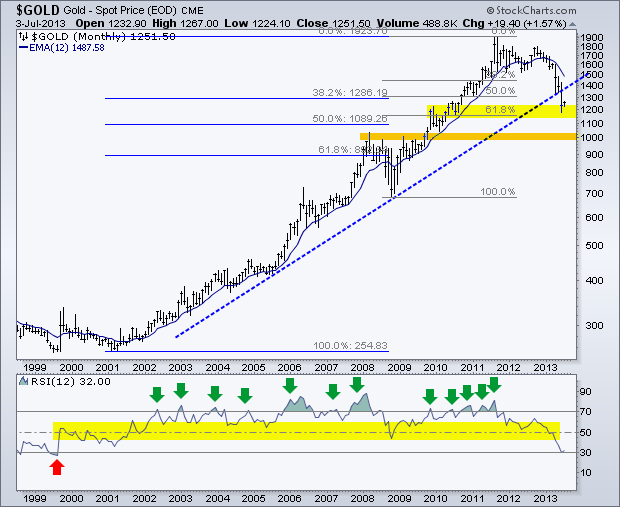
Gold is medium-term oversold and ripe for a bounce, but the long-term trend remains down with a target in the $1000 area. There are two big moves defined by two sets of retracement lines on this chart. The first extends from the 2001 low to the 2011 high (±250 to ±1900)... Read More