The FOMC will be meeting to discuss a potential rate hike in less than two weeks. A hike would continue the hawkish tone that began when the FOMC increased interest rates in December 2015 for the first time in nine years. It was about six months later that the 10 year treasury yield ($TNX) began its ascent after first printing a double bottom. Check out this 10 year weekly chart:
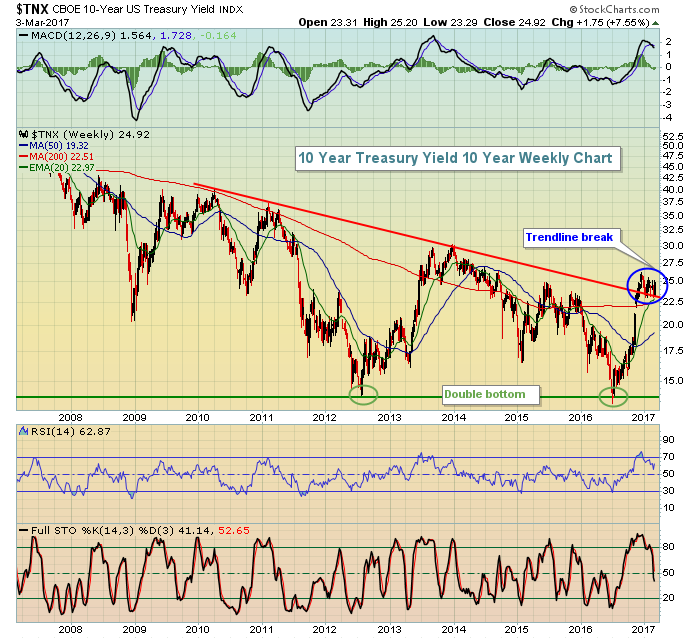 The TNX bottomed with relatively equal lows just beneath 1.40% in 2012 and 2016. I believe the rate hike in 2015 signaled the end of descending treasury yields and that we're now in a period of rising rates - at least until more significant yield resistance approaches. For that, let's turn to a much longer-term monthly chart on the TNX:
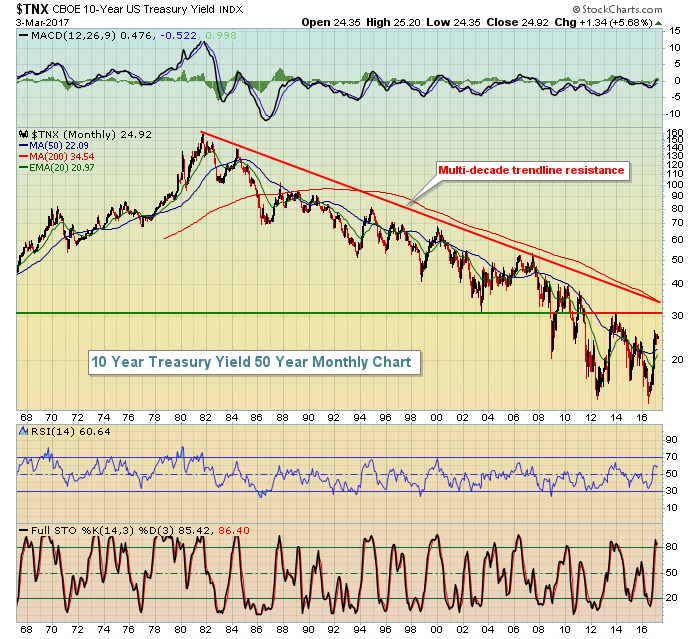 Note a few technical items here. After the initial bottom near 1.40% was set, the reaction high on the next rise was close to 3.00% in early 2014. That's a more significant yield resistance level and I believe the TNX is heading there. Once it gets there, things will get interesting. The longer-term trendline currently resides just below 3.50% and the 200 week MA is at 3.45%. The TNX has not been above its 200 week MA since 1987. Another technical item of note is the low reached back in 2003 close to the 3.00% level. There's been a history of the 3.00% yield serving as a major pivot level. Therefore, we'll want to watch that level very carefully as we approach it. Finally, the last bull market from 2002 to 2007 occurred with rapidly rising treasury yields. Keep in mind that when yields are rising, the market is suggesting that economic conditions will improve, leading to higher EPS for S&P 500 companies. It also means that there are tons of sellers of treasuries as treasury yields move opposite of treasury prices. As money moves out of treasuries in an improving economy, that money many times finds a home in equities. And that's exactly where we sit now.....with money rotating away from defensive treasuries. So long as economic conditions do improve, money flowing out of treasuries could sustain the current bull market in equities and could result in a very big move higher in the S&P 500.
That brings me to home construction ($DJUSHB). Recent action in the DJUSHB has been extremely bullish with the group breaking to decade highs on a weekly closing basis. Does that make sense with yields moving up? Doesn't that mean home prices and construction will slow because it will get more expensive to own a home? Well yes, but interest rates are very close to historic lows and homes remain quite affordable given those low rates. Also, the anticipation of improving economic conditions means more jobs, higher consumer confidence, etc. - the things that lead to a housing boom. Finally, the stock market is anticipating a much more friendly environment for lending with deregulation on President Trump's agenda. I believe this breakout represents the culmination of all of these factors. Take a look at the chart:
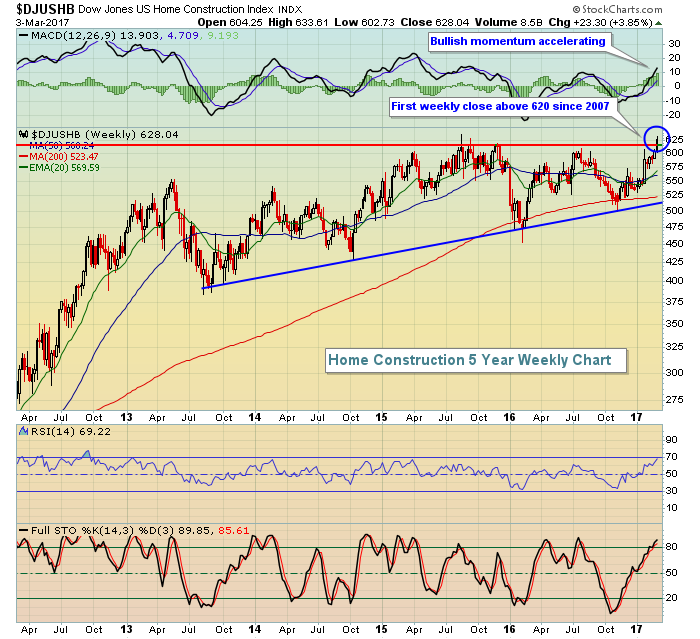 One final comment. I haven't reflected it above, but when the TNX surged from 3.00% to more than 5.00% in 2007, the home construction index also surged, more than tripling in a little more than two years. While I'm not looking for that type of move higher, it is important to note that higher treasury yields and mortgage rates do not necessarily result in a poorly performing home construction group - even though common sense might drive you to that conclusion.
I've written an article in my Trading Places blog that addresses possible trading ideas as a result of the home construction breakout. CLICK HERE to review that article.
Happy trading!
Tom
