Most of us are aware of the tracking error between oil and the US Oil Fund. There is indeed a tracking error, but a few charts reveal that this tracking error is subject to fluctuations and can even remain stable for extended periods. Today I will show how to measure tracking errors between ETFs and the underlying asset. Gold and oil will be used for examples, but these techniques can be applied to any ETF and its underlying asset, be it an index or commodity.
There are two ways to chart the tracking error between an ETF and the underlying asset. Chartists can use a Performance SharpChart to compare the percentage change over time or chartists can plot a ratio to measure the relative performance. We must also choose between the most active futures contract and the continuous futures contract. As a general rule of thumb, I would defer to the most active futures contract when making a comparison. Continuous contracts work well for most metals and currencies, but do not work well for energy-related commodities, such as oil and natural gas. Note that continuous contracts are created by stitching together individual futures contracts.
Comparing the Percentage Change over Time
The chart below shows the performance for the Gold SPDR (GLD), Gold Futures April 2017 (^GCJ17) and Gold Continuous Contract ($GOLD) over a six month period. All three lines are quite close together and this reflects a very small tracking error.
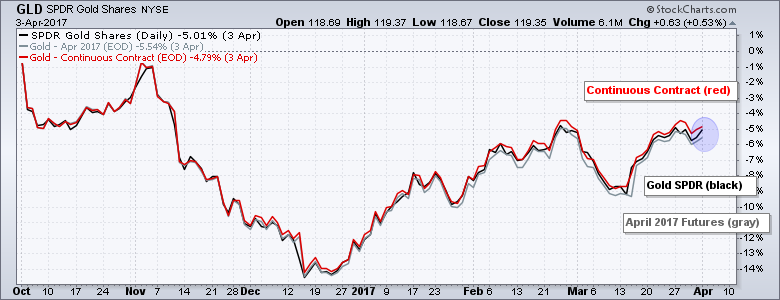
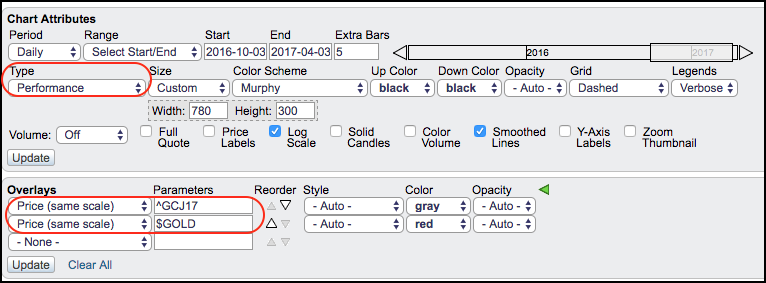
Chartists can create this chart by adjusting the settings in the chart attributes section. GLD is the main symbol and it is plotted using “Performance” as the chart Type. This shows the percentage change for GLD over the last six months. I then added Gold Futures April 2017 (^GCJ17) and Gold Continuous Contract ($GOLD) by using “Price (same scale)” as an Overlay. This plots all three symbols using the same scale and makes it easy to compare performance.
Plotting Ratios to Compare Performance
Chartists can also compare performance by using ratio charts. The ratio rises when the numerator rises more than the denominator and falls when the numerator falls more than the denominator. The top window in the example below plots the GLD:^GCJ17 ratio to compare the performance of the ETF with the futures contract (GLD is the numerator). The bottom window plots the GLD:$GOLD ratio to compare the ETF to the continuous contract.
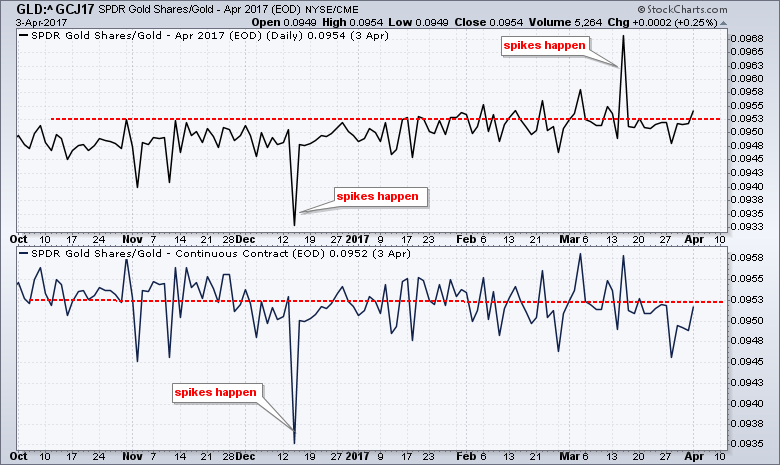
Notice that both of these lines are flat, which is not surprising after seeing how close the performance lines were in the Performance Sharpchart above. These three track each other quite closely and there is not much of a tracking error with the Gold SPDR (GLD). There were a few spikes, but we cannot expect perfection. Overall, both ratios were flat over the last six months and this reflects a low tracking error.
Oil ETF Does Not Track as Well
The next chart compares the percentage change for the US Oil Fund (USO), Light Crude Futures May 2017 (^CLK17) and Light Crude Continuous Contract ($WTIC). This chart looks a little different than the gold chart above and we can immediately see some tracking issues. First, the continuous contract (red) shows a bigger gain than the other two. Second, USO (black) underperformed the May futures contract most of the period. Notice that the black line was below the gray line the last five months. There is clearly a tracking issue between USO and the underlying commodity.

The next chart shows two ratios to plot relative performance over time. A flat ratio means flat performance and a stable tracking error. The rising ratio means the ETF outperforms over time and a falling ratio means the ETF underperforms over time. Either way, it is a tracking error. The US Oil Fund (USO) tracked the May futures contract quite well because the ratio was flat from mid November to March. This is a bit of a surprise and shows that USO tracks the individual futures contract pretty well. USO did not track the continuous contract very well at all. I am not concerned because the continuous futures contract is stitched together and it often not the best representative for the underlying asset price.

Tracking Error Can Stabilize
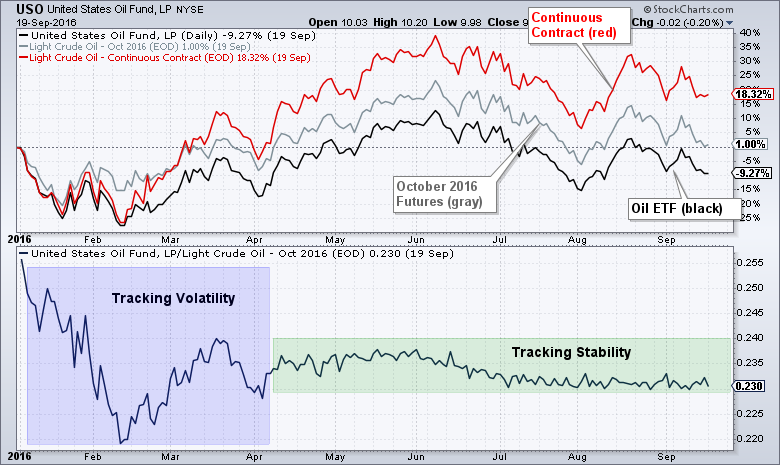
I am not going to get into the reasons for the tracking error in many energy ETFs. In short, it is related to contango and contract rollovers. You can Google “oil ETF tracking issues” for more information. It is important to note that the tracking error is not constant and can stabilize. The chart below shows performance for the US Oil Fund, Light Crude Futures October 2016 and the Continuous Contract. Once again, the Continuous Contract did not track well and should not be used for comparison. As of 19-Sep-16, USO was down 9.27% and the Futures Contact was up 1%. This is clearly a large tracking error, but perhaps it is not as large as it seems. The bottom window on the chart shows a ratio plot to put this into perspective. The USO:^CLV16 ratio bounced around from January to March and this reflected tracking volatility. Notice that the tracking error was quite wide in February and remained about as wide the rest of the time. USO mostly lagged the futures contract. This tracking volatility, however, stabilized from April to September as the ratio flattened. The tracking error was still there, but remained stable for six months. This is just one example and the tracking error will not doubt be different for different time periods and different ETFs.
Conclusions
Chartists do not need to worry about tracking errors for metal and currency ETFs, but should keep an eye on the tracking error for energy-related ETFs. Similarly, chartists can use the continuous futures contracts to compare performance with the metals ETFs. The situation changes with the energy-related ETFs. Chartists should not use the continuous futures contracts for comparison. Choose instead a near-by futures contract. Even so, there are likely to be tracking errors with energy-related ETFs Traders can minimize these tracking errors by trading short-term, a few weeks to a few months. The chances of a tracking error increase along with the holding period. Anything longer than six months is likely to generate a sizable tracking error. Thus, energy-related ETFs are definitely not for long-term investors. You can find a symbol list of futures contracts here and a list for continuous contracts here.
Follow me on Twitter @arthurhill - Keep up with my 140 character commentaries.
****************************************
Thanks for tuning in and have a good day!
--Arthur Hill CMT
Plan your Trade and Trade your Plan
*****************************************