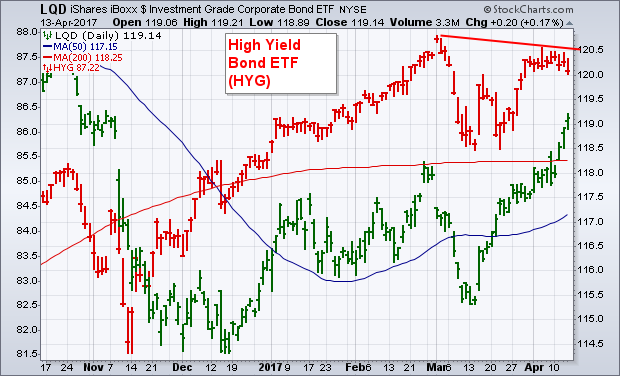
The green bars in the chart below show the iBoxx Investment Grade Corporate Bond iShares (LQD) trading at a new five-month high after clearing its 200-day average. The red bars, however, show the iBoxx High Yield Corporate Bond iShares (HYG) backing off from its early March high. The fact that investment grade bonds are rising, while junk bonds are weakening, carries a potentially negative message for stocks. That's because junk bonds are more closely correlated with stocks than bonds.
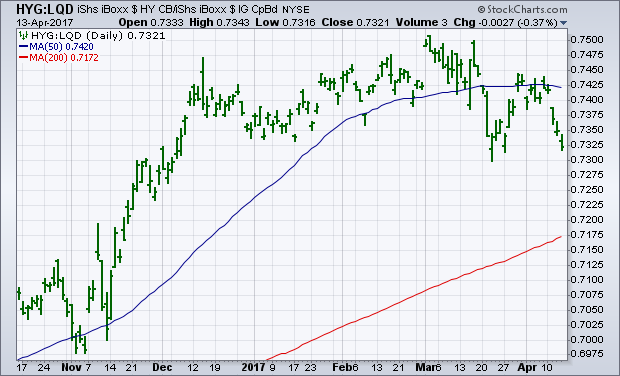
 JUNK BONDS UNDERPERFORM... It's often instructive to see what various bond categories are doing relative to each other. That can tell us something about the mood of the bond market, as well as stocks. Right now, that mood is defensive. The green bars in the next chart show a relative strength ratio of the high yield bond ETF (HYG) divided by the investment grade ETF (LQD). The rising ratio since November favored high yield bonds. That's also when stock prices were rising. The falling ratio over the last month shows high yield bonds lagging. That also shows loss of risk appetite between the two bond categories. The falling HYG/LQD ratio also sends a negative message for stocks.