The McClellan Oscillator is a breadth indicator that Chartists can use to enhance their analysis of an index. StockCharts carries the McClellan Oscillator for dozens of broad market indexes, but not for the S&P sectors. There is no need to fret because StockCharts users can create the McClellan Oscillator using the AD Percent indicators and MACD. You can read more about the McClellan Oscillator in our ChartSchool.
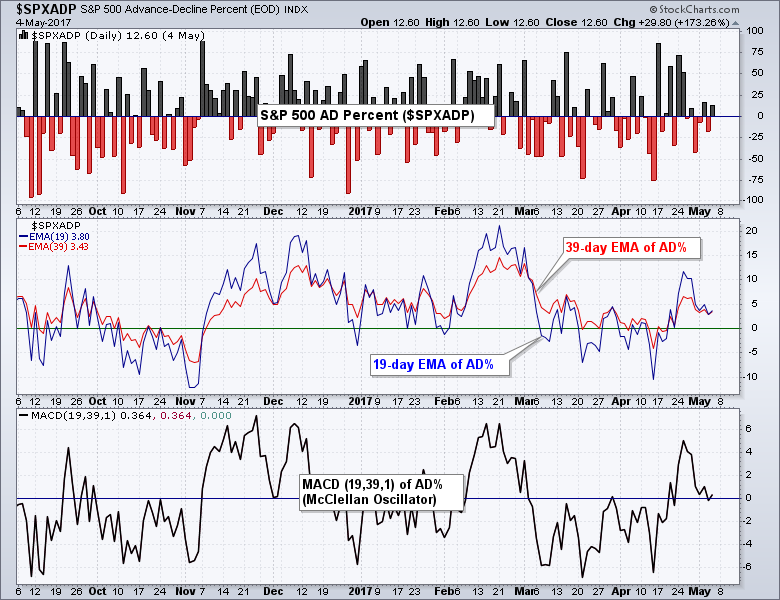
We first need a base symbol, which can be AD Percent or AD Volume Percent. As an example, AD Percent equals advances less declines divided by total issues. You can find a complete list of these symbols here. I will use S&P 500 AD Percent ($SPXADP) for an example. The chart below shows daily values for AD Percent as a histogram in the top window. The second window shows the EMAs used in the McClellan Oscillator for reference (19-day EMA and 39-day EMA). The McClellan Oscillator is the difference between these EMAs and chartists can plot this difference by applying MACD to AD Percent, which is shown in the third window. MACD equals the fast EMA less the slow EMA. In this case, MACD(19,39,1) is the 19-day EMA less than 39-day EMA. The signal line is hidden because signal line EMA is set to "1".
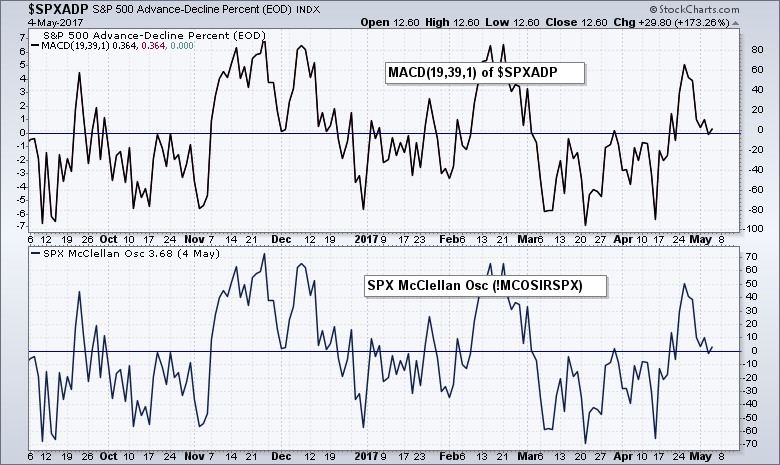
And...just to prove that this really is the McClellan Oscillator, the next chart shows MACD (19,39,1) of S&P 500 AD Percent ($SPXADP) in the upper window and the S&P 500 McClellan Oscillator (!MCOSIRSPX) in the lower window. The lines have the exact same shape and cross the zero line at the same time. The absolute values are different because of a decimal point difference.
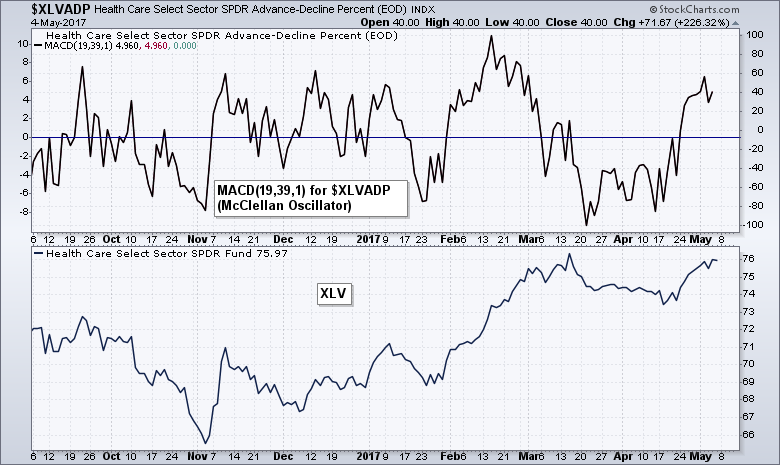
Chartists wishing to create the McClellan Oscillator for a sector simply need to change the main symbol. Also note that you can click any of these charts to see the settings and/or save it to your favorites list. The chart below shows the McClellan Oscillator for the HealthCare SPDR (XLV) using HealthCare AD Percent ($XLVADP) with MACD.
 Here are the AD Percent symbols for the nine sectors and the Gold Miners ETF: $XLKADP, $XLFADP, $XLIADP, $XLYADP,$XLVADP, $XLPADP, $XLUADP, $XLBADP, $XLEADP, $GDXADP
****************************************
Thanks for tuning in and have a good weekend!
--Arthur Hill CMT
Plan your Trade and Trade your Plan
*****************************************