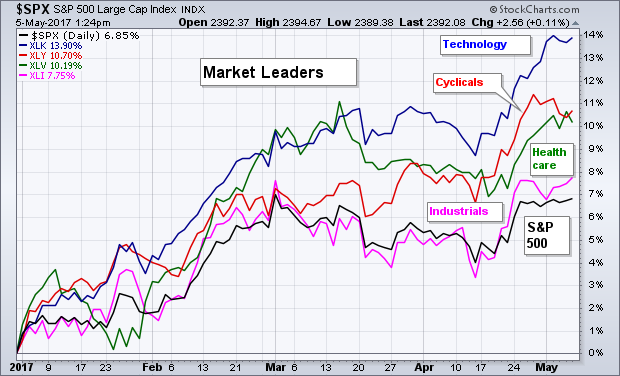
SECTOR LEADERSHIP... One of the problems facing the current stock market is that some sectors have been rising, while others have suffered large losses. Since the start of the year, for example, technology has gained nearly 14% versus a 6.7% gain for the S&P 500. Energy stocks, however, have plunged -10% this year. Industrial metal miners have lost -6% as have telecom stocks. Obviously there's a tug of war going on within the market as a whole. The question is which side is winning. To determine that, it's not just enough to count how many sectors are rising (8) and how many are falling (3) and by how much. We have to also consider how those sectors are weighted in the S&P 500. That gives us a better measure of how much the winners are impacting the S&P 500 versus the losers. Chart 1 shows the top four sector gainers since the start of year to be technology (13.7%), consumer discretionary (10.4%), healthcare (10.3%), and industrials (7.6%). All four did better than the S&P 500's gain of 6.8%. Four outperformers out of eleven sectors might not sound like much. But those four account for 57% of the S&P 500 weightings. Technology accounts for nearly 20%, healthcare (15%), cyclicals (12%), and industrials (10%). That alone gives an edge to the bulls.
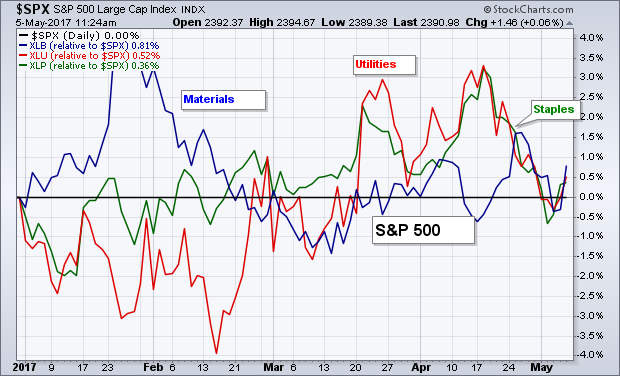
 AVERAGE SECTOR PERFORMERS... Chart 2 shows three sectors that have pretty much matched the S&P 500. This chart, however, plots the three on a "relative strength" basis versus the S&P 500. In other words, they're plotted around the S&P 500 which is the flat zero line. They include materials, utilities, and staples. The percentage numbers on the top left scale show them outperforming the S&P 500 by a slight margin (less than 1%). [In absolute terms, all three gained more than 7% versus 6.7% for the S&P 500]. The one surprise in that group is materials which includes base metals like copper and steel which have been falling. Gains in chemical stocks along with those tied to containers and packaging, however, offset those commodity losses. In addition, materials account for only 3% of the S&P 500. The same is true of utilities. Staples account for 9%. That makes for another 15% of the S&P 500 that has kept pace with the market. So far, we have 67% of the S&P 500 which is either leading it higher or matching its gains.