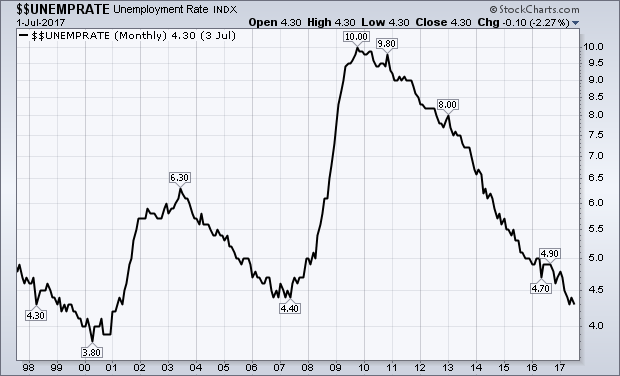
IS THIS THE REAL UNEMPLOYMENT RATE? ... Friday's job report saw 209,000 new jobs added during July which was well above expectations. Hourly earnings also saw a July again of 0.3% which attracted the most attention. That, however, leaves the year over year rise in wages at a relatively flat 2.5%. That's higher than the inflation rate, but well below what we should be seeing at this point in the economic expansion. Chart 8 shows the unemployment rate falling below its 2007 low of 4.4% to the lowest level in sixteen years (2001). Economists at the Fed remain puzzled as to why wages aren't rising faster in the face of near full employment. That may result from looking at the wrong numbers. The unemployment rate shown below (U-3) doesn't include people who have stopped looking for work; and counts part-time workers as fully employed. A broader measure of unemployment (U-6) includes those unemployed or underemployed and currently sits at 8.6%. That's twice as high as the number everyone is looking at. The spread between the two is also much wider than it was in 2000 and 2007 when the unemployment rate was this low. That suggests that we're nowhere close to real full employment. So does the low percent of workers participating in the work force.
 LABOR PARTICPATION RATE IS STILL TOO LOW... The labor force participation rate currently sits at 62.9% which is close to the lowest reading since 1977. That rate measures the percent of adult Americans who are no longer participating in the work force. Prior to 2000, the rate rose consistently for forty years. It peaked at 67% in 2000 and fell more sharply after the 2008 financial crisis. It bottomed in 2016 at 62.8% and has barely budged since then. That also seems to suggest that there's still a lot of slack in the work force. The current annual wage gain of 2.5% is also well below the 4% level seen in 2000 and just prior to the financial crisis in 2008 when the unemployment rate was this low. Something seems to have changed over the past two decades. I suspect it's the fact that deflationary forces took hold after 2000 (and again in 2008) and are just now starting to lift. That would account for why employers have been slow to higher and more stingy with wages. I can't help but wonder if the Fed is taking all of these factors into consideration. If it isn't, why not? And if it is, why does it remain so puzzled about the lack of wage inflation? One reason is that the Fed expects an economy nearing full employment to produce higher wages. But it may be looking at the wrong numbers to gauge full employment (or ignoring those that paint a weaker picture). It also believes that higher wages lead to higher inflation. I suspect it's the other way around. And that higher inflation leads to higher wages. It's harder for employers to raise wages when they can't raise prices enough to offset higher labor costs. That hurts their bottom line. Rising prices encourage more hiring and higher wages.