As the Dow Jones Industrial Average (DJIA) has been moving steadily to record highs, I have observed a persistent erosion of underlying support as expressed by 52-Week New Highs for the DJIA component stocks. The New High peak in March represents the highest level reached recently, and we can see a steady decline in the number of New Highs since then. Of particular concern is the contraction of New Highs in the last few weeks, which happened even as the DJIA squirted higher for nine days straight.
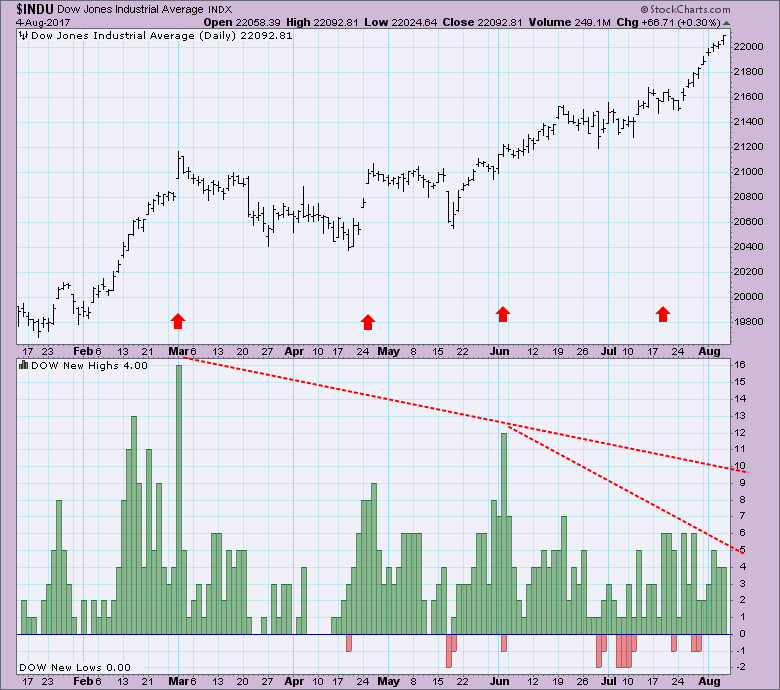
In a bull market a spike in New Highs usually represents a buying climax, after which a period of churning or decline is likely to take place. It is not necessarily a period of danger, rather it simply a consolidation of gains, and represents the normal ebb and flow of market activity; however, the recent divergence is a little more concerning.
Looking at a much broader picture, the NYSE Composite New Highs have performed in a manner similar to the DJIA, especially so in regard to the divergence of price and New Highs seen in the last few weeks. In addition to the contraction of New Highs, we are also seeing an expansion of New Lows. This expansion of New Lows has not reached an alarming level, but it is at a higher level than normal and is of concern when we consider the contraction of New Highs.
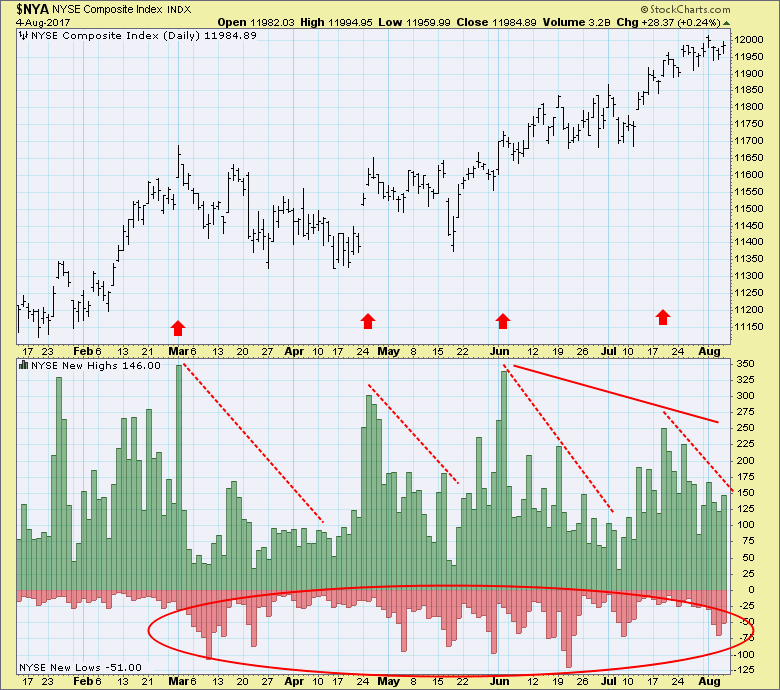
Conclusion: While price has moved steadily higher, New Highs have contracted and New Lows have expanded. This divergence has become more pronounced in the last few weeks and should cause us concern regarding the market's underlying weakness.
Happy Charting!
- Carl
Technical Analysis is a windsock, not a crystal ball.
**Don't miss DecisionPoint Commentary! Add your email below to be notified of new updates"**
Helpful DecisionPoint Links:
DecisionPoint Shared ChartList and DecisionPoint Chart Gallery
Price Momentum Oscillator (PMO)
Swenlin Trading Oscillators (STO-B and STO-V)