This week the US Dollar climbed to its highest level in two months. For those who have been following the Commodities Countdown articles, the reversal in the $USD was expected from the big downtrend. The three-year chart of the $USD shows the Euro turning higher at the start of 2017, the British Pound basing until March and then turning higher and the Canadian Dollar bottoming in May and surging higher. With every chart making new 52-week highs against the Dollar, this is a significant technical change. The $USD made new two-year lows. The macro suggests major change is afoot.
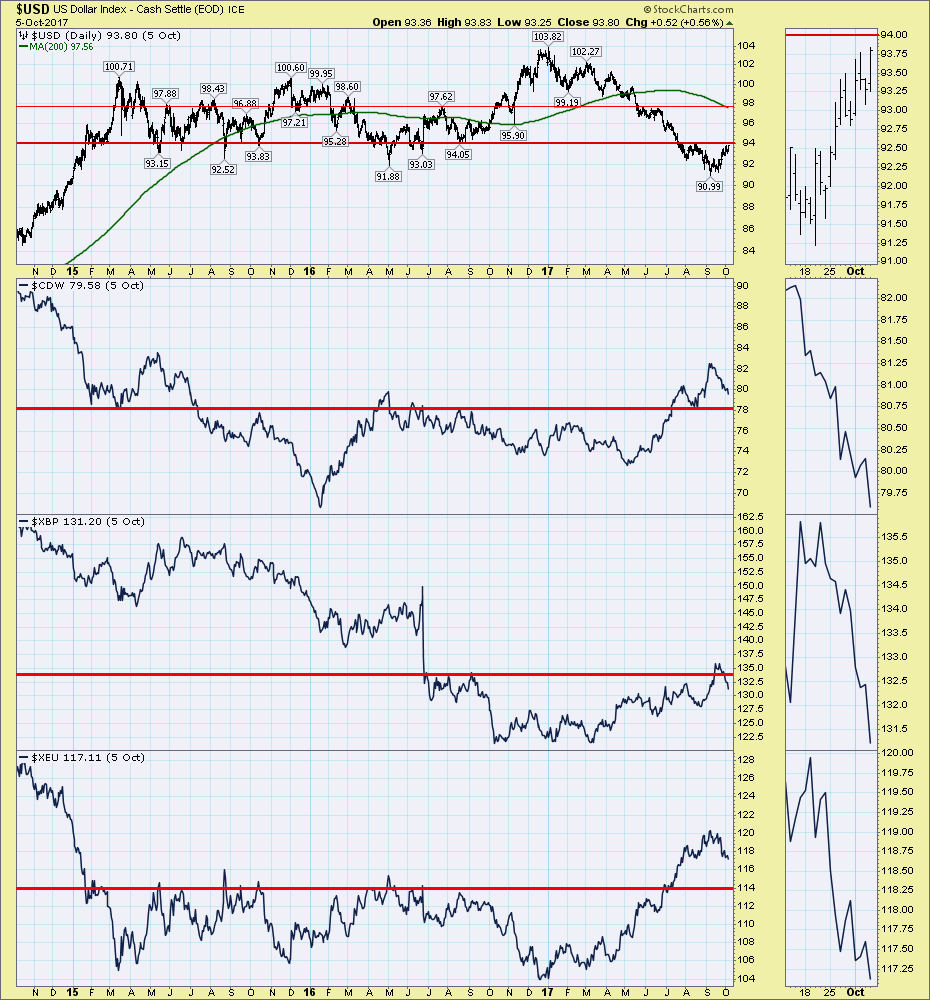
I have also placed a horizontal line at 97.6 on the $USD panel which is an important level. The 200 DMA is hovering in that area as well.
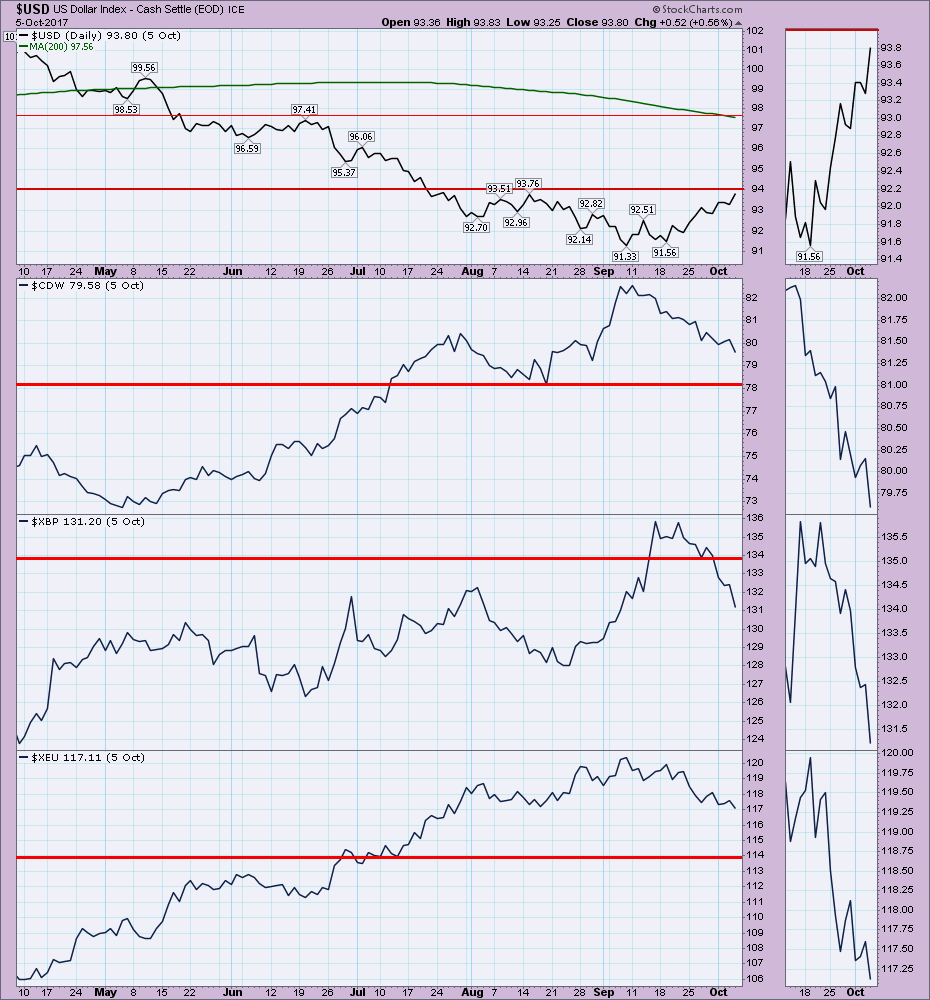
Zooming in on the currencies for the last 6 months, the chart below shows the sudden drop of the currency pairs since September 8. September 8 marks the low close for the $USD. The British Pound had one more one day run but has since given it all back.
 With this acceleration higher, other stock markets have roared forward as their currencies have dropped. In the chart below, I have changed the currencies of the other countries to the stock market indexes. $TSX = Canada, $FTSE = UK, $DAX = Germany. All three of these charts have surged to importance resistance levels. The $DAX has broken through.
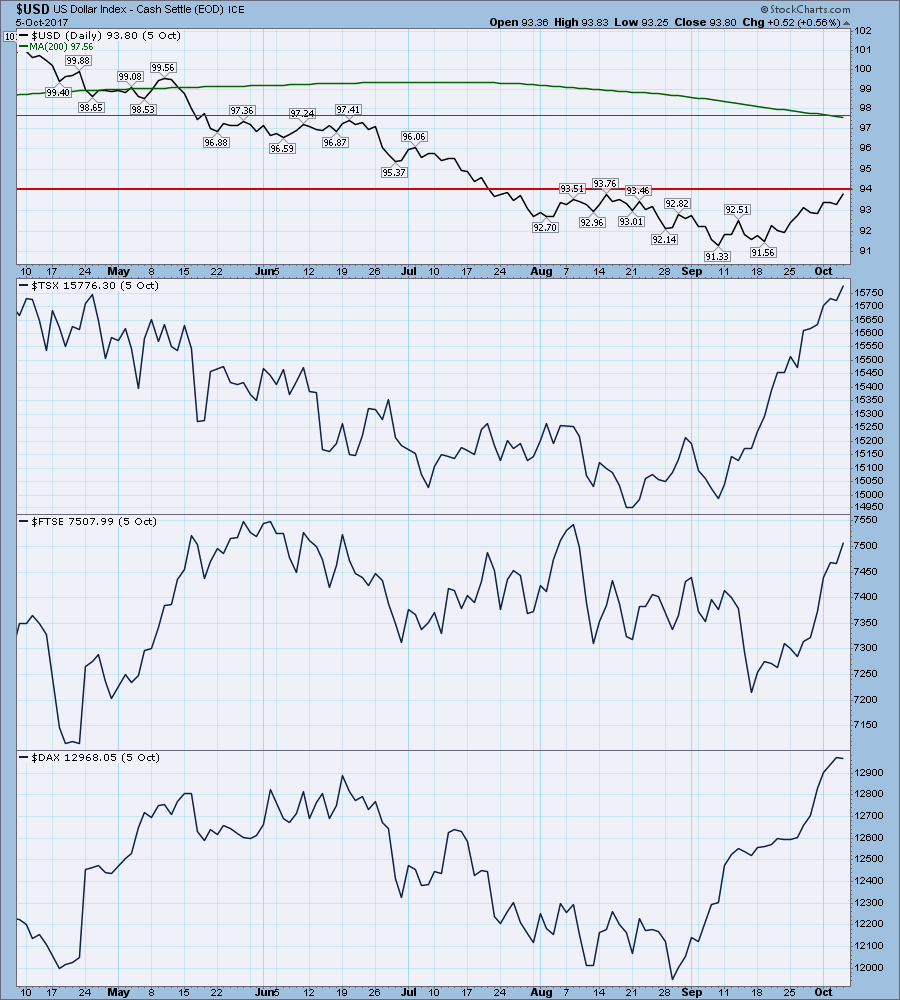 The continuing surge in the $USD will allow these charts to continue to run. If the $USD reverses and starts falling again, these other markets may stall at important resistance. We are in a global rally. The real question is can they keep running if the $USD stalls and turns weak again? The $USD might be the most important chart to watch in the fourth quarter. Is this sudden outperformance by foreign markets a new trend with a rising US Dollar? Historically, the global bull market in Emerging Markets began in 2002 when the US Dollar topped and weakened. The move over the last four weeks would dispute that same thing happening. While this chart does not give us the answers, it does suggest we watch the $USD relationships closely for clues.
Good trading,
Greg Schnell, CMT, MFTA
