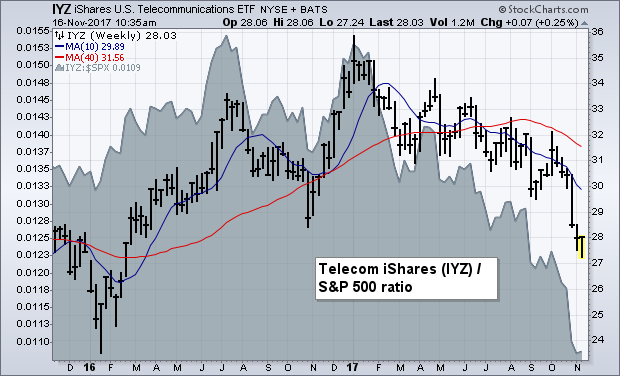
The recent selloff in high yield junk bonds has attracted a lot of attention in the financial media. My Tuesday message showed the iBoxx High Yield Corporate Bond iShares (HYG) headed down for a test of chart support at its August low and its 200-day moving average. Chart 1 shows the HYG scoring an upside reversal day yesterday after touching its 200-day average (green circle). That positive action is being followed by a gap higher today. Those are encouraging signs that the selloff in high yield bonds may have run its course. The 14-day RSI line (top of chart) also shows that the HYG had fallen into an oversold condition below 30. One encouraging sign for the junk bond market is that most of its recent selling has been contained mainly in one sector. And that's telecom.
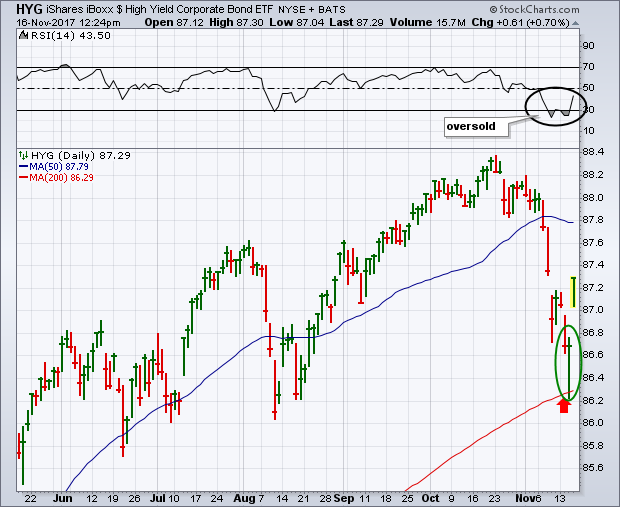 The weekly bars in Chart 2 show the U.S. Telecommunications iShares (IYZ) falling to the lowest level since the start of 2016. Its relative performance looks even worse. The gray area in Chart 2 shows a ratio of the IYZ divided by the S&P 500 also plunging throughout the year. The telecom sector has lost -16% this year, making it the market's weakest stock sector. When a sector's stocks are under that kind of downside pressure, some of that selling can spill over to bonds issued by those companies. And telecom accounts for about 25% of high yield bonds. That's what's been causing most of the recent selling in high yield bond ETFs. Fixed income analysts are encouraged by the fact that most of the recent selling in high yield bonds has been limited to that one sector. Stock analysts may be encouraged by the fact that telecom has the smallest sector weighting in the S&P 500 (1.8%). That may explain why stocks in general haven't been that negatively effected by weakness in the telecom group and their bonds. In addition, several of those individual telecom stocks look oversold.