ChartWatchers

Energy Shares Are Bouncing on Optimism Over OPEC Agreement

John Murphy

John Murphy

Chief Technical Analyst, StockCharts.com

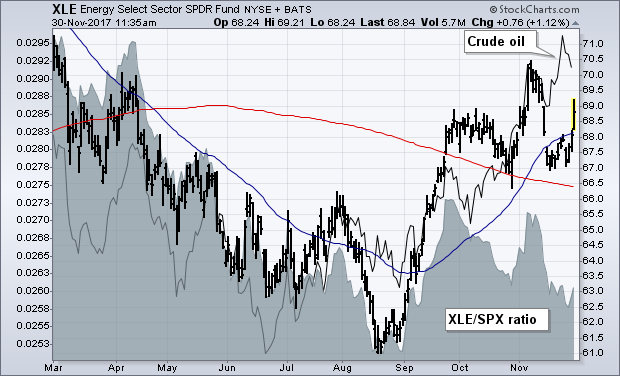
Energy shares are finally showing some bounce. The daily bars in the chart below shows the Energy Sector SPDR (XLE) climbing above its 50-day average today. The XLE is bouncing off chart support along its late October low and its 200-day moving average. Those are logical chart points for the XLE to start moving higher. [The 50-day average remains higher than its 200-day line which is also a positive sign]. The gray area (which plots a ratio of the XLE divided by the S&P 500) has been slipping over the last two months. But it's rising today with energy being one of the day's strongest sectors. That's probably based on reports that OPEC has agreed to extend production cuts to the end of 2018. Energy shares have lagged behind rising oil prices which recently hit the highest level in two years. It's time for them to start catching up.


John Murphy
About the author: is the Chief Technical Analyst at StockCharts.com, a renowned author in the investment field and a former technical analyst for CNBC, and is considered the father of inter-market technical analysis. With over 40 years of market experience, he is the author of numerous popular works including “Technical Analysis of the Financial Markets” and “Trading with Intermarket Analysis”. Before joining StockCharts, John was the technical analyst for CNBC-TV for seven years on the popular show Tech Talk, and has authored three best-selling books on the subject: Technical Analysis of the Financial Markets, Trading with Intermarket Analysis and The Visual Investor. Learn More