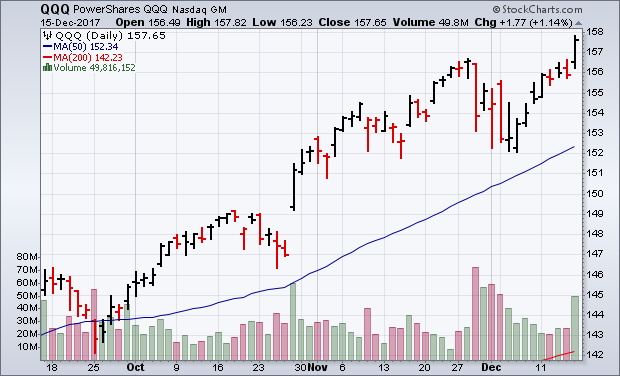
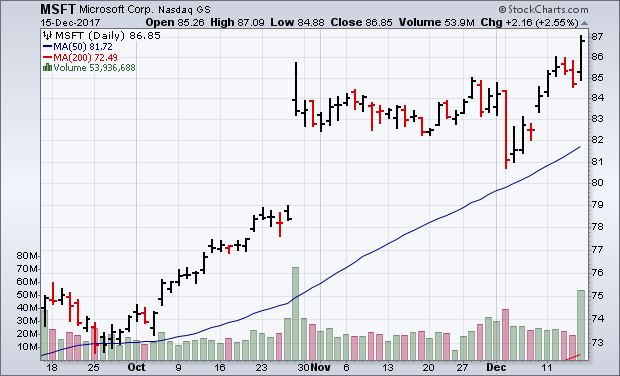
The Nasdaq finally joined the Dow and S&P 500 in record territory on Friday. Chart 1 shows the PowerShares QQQ exceeding its November peak at week's end, and in heavy trading. The QQQ is based on the Nasdaq 100 index which includes the 100 largest non-financial stocks. Most of them are in technology. One of the biggest contributors to that gain was Microsoft. Chart 2 shows Microsoft (MSFT) gaining more than 2% on Friday to reach a new record. It did so on the heaviest trading in two months. It's always encouraging to see all of the major stock indexes hitting new highs together. One stock index that didn't hit a new high was the Russell 2000 Small Cap Index. But it may be heading in that direction.
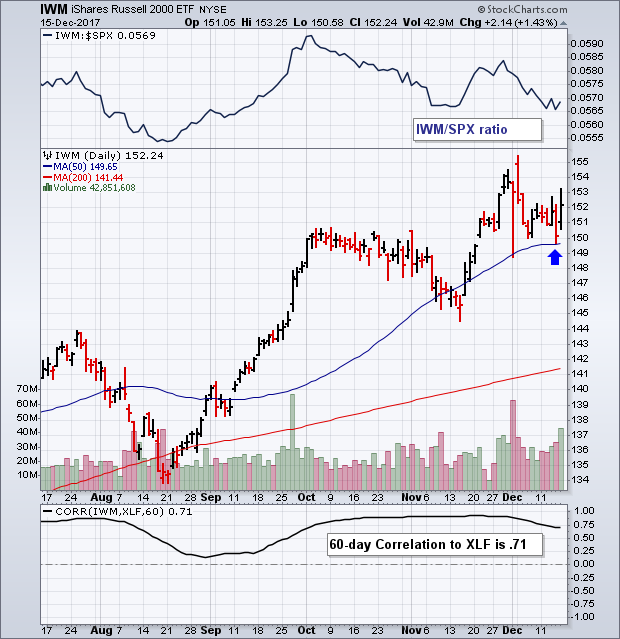
 RUSSELL 2000 ISHARES BOUNCE OFF 50-DAY AVERAGE... News on Friday that passage of the tax reform package might be imminent gave a big lift to stocks. Small caps got the biggest lift. Chart 4 shows the Russell 2000 iShares (IWM) bouncing impressively off its 50-day moving average (blue arrow). And on rising volume. That makes sense considering that domestically-oriented small cap stocks stand to gain more from a tax cut than larger multinational stocks. Small stocks, however, have been lagging behind over the past two months. That can be seen by the IWM/SPX ratio on top of Chart 3. But that may not last for long. Financials make up the biggest part of the Russell 2000 (18%). And financials have been market leaders on hopes for tax reform. The 60-day Correlation Coefficient between the IWM and the Financial Sector SPDR (XLF) is a relatively high figure of .71 (bottom of chart). That means they usually trend in the same direction. Two other groups with high correlations with the IWM are consumer discretionary (.70) and industrials (.60). Those two economically-sensitive sectors have been also been market leaders. That may carry good news for small cap stocks, especially if the tax package passes this coming week as expected.