 There were eight breadth thrusts in the month of May and seven of these were bullish (>70%). In particular, there were three bullish breadth thrusts last week. These strong readings show broad participation and give the bulls the edge going forward.
Chartists can measure daily breadth by using the AD Percent indicators for the S&P 500, S&P Mid-Cap 400 and S&P Small-Cap 600. AD Percent = (Advances - Declines) / Total Issues. This shows net advances as a percentage of total issues and we can compare these values across indexes. I use +70% to signal a bullish breadth thrust and -70% to signal a bearish breadth thrust. In S&P 500 terms, this means at least 425 of the 500 stocks in the index advanced (425-75 = 350 and 350/500 = 70%).
The chart below shows S&P 500 AD Percent ($SPXADP), S&P MidCap AD Percent ($MIDADP) and S&P SmallCap AD Percent ($SMLADP) in histogram format for easy analysis. The blue lines are set at +70% and -70% with the green arrows marking seven bullish thrusts and the red arrow marking the single bearish thrust.
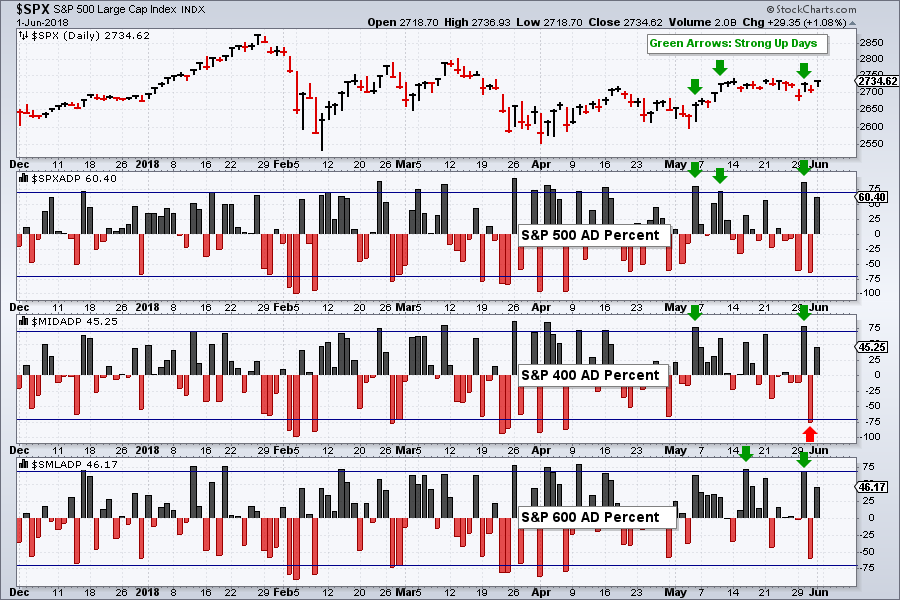
Last week was quite volatile with some large swings in AD Percent. All three indexes triggered bullish breadth thrusts on Wednesday and only $MID triggered a bearish breadth thrust on Thursday. Downside participation in $SPX and $SML was not strong enough to trigger a bearish breadth thrust. I will err on the bullish side until we see bearish breadth thrusts in large-caps and small-caps.
On Trend with Arthur Hill
On Trend airs every Tuesday at 10:30 AM on StockChartsTV, and repeats throughout the week. There is also a video archive on Youtube. StockChartsTV and the video archives are available to everyone.
Highlights from On Trend for Tuesday, May 29th
- What do Trendlines Actually Measure
- Measuring Risk On/Off (Dollar, Gold, Yen, Treasuries)
- Euro Breaks Down and Yen Bounces
- Gold Becomes Oversold within an Uptrend
- Italy and Spain Lead Europe Lower (international index symbols)
- QQQ, Top QQQ Stocks, XLF and XLV
Plan Your Trade and Trade Your Plan.
- Arthur Hill, CMT
Senior Technical Analyst, StockCharts.com
Book: Define the Trend and Trade the Trend
Twitter: Follow @ArthurHill