Editor's Note: This article was originally published in John Murphy's Market Message on Wednesday, November 14th at 1:39pm ET.
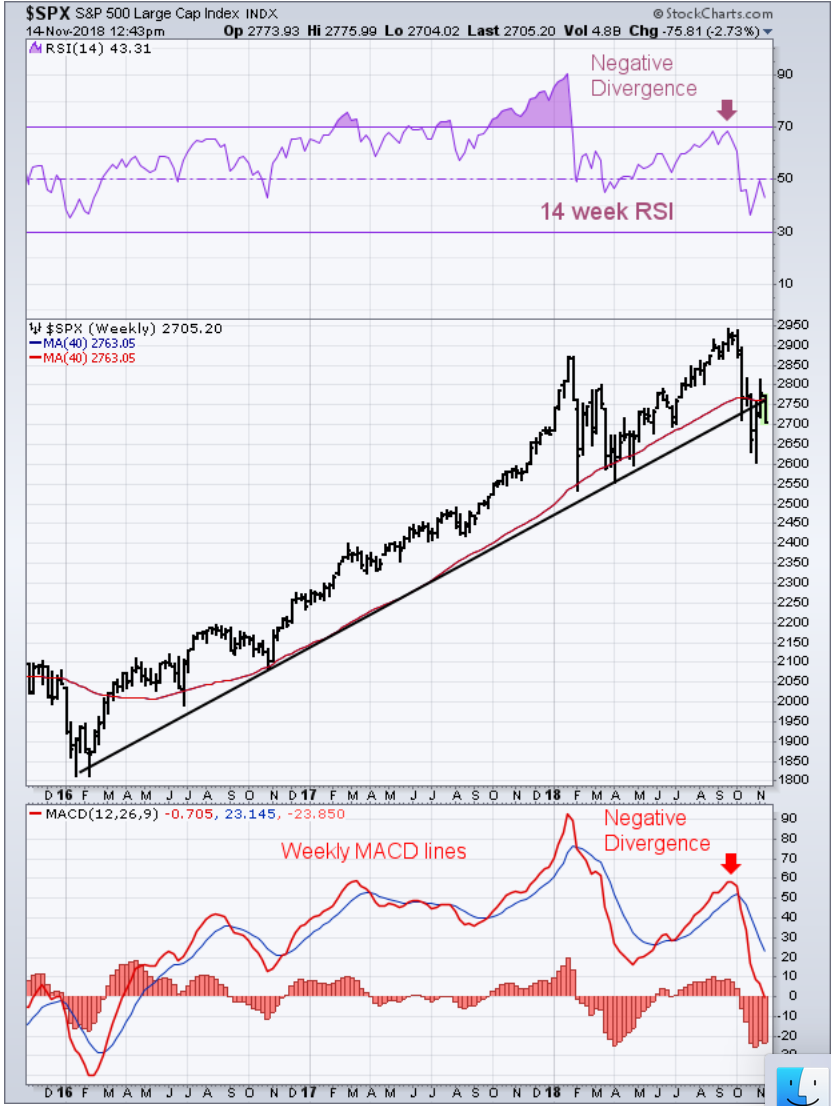
The weekly bars in Chart 2 show the last upleg of the S&P 500 uptrend that began in early 2016. And it shows that uptrend weakening. It shows the October price drop falling below its 40-week moving average (red line) by the widest margin in more than two years, and a rising trendline drawn under its 2016-2018 lows. This week's attempt to regain those two previous support lines is failing. The two weekly indicators in Chart 2 also paint a negative picture that suggests that the nearly three-year uptrend is in danger. The 14-week RSI line (top box) has fallen below 50 by the widest margin since early 2016. In addition, its third quarter peak fell well short of its early 2018 peak which formed a major negative divergence (purple arrow). Its weekly MACD lines (lower box) show a similar negative divergence (red arrow), and have since fallen below their spring low to the weakest level in more than two years. That's not a minor setback to the market's last upleg. It's a big one. That largely explains why short-term rally attempts aren't getting very far. Weak longer range signals on weekly charts are simply over-riding any short term rally attempts. Monthly chart readings aren't encouraging either.
Chart 2