In my Thursday article in the DecisionPoint blog, I discussed the new PMO BUY signals on the DP Scoreboards, finishing off the article with a chart of the Healthcare Sector ETF (XLV) after I received a new Intermediate-Term Trend Model BUY signal (a positive 20/50-EMA crossover on the daily chart). I decided to research further because today's daily chart for XLV looked particularly bullish. I thus wasn't completely surprised to see healthy (pun not intended) weekly and monthly charts. This reminds me very much of the set-ups I've written about in past articles on the Natural Gas and Real Estate sectors. Those turned out to be very accurate.
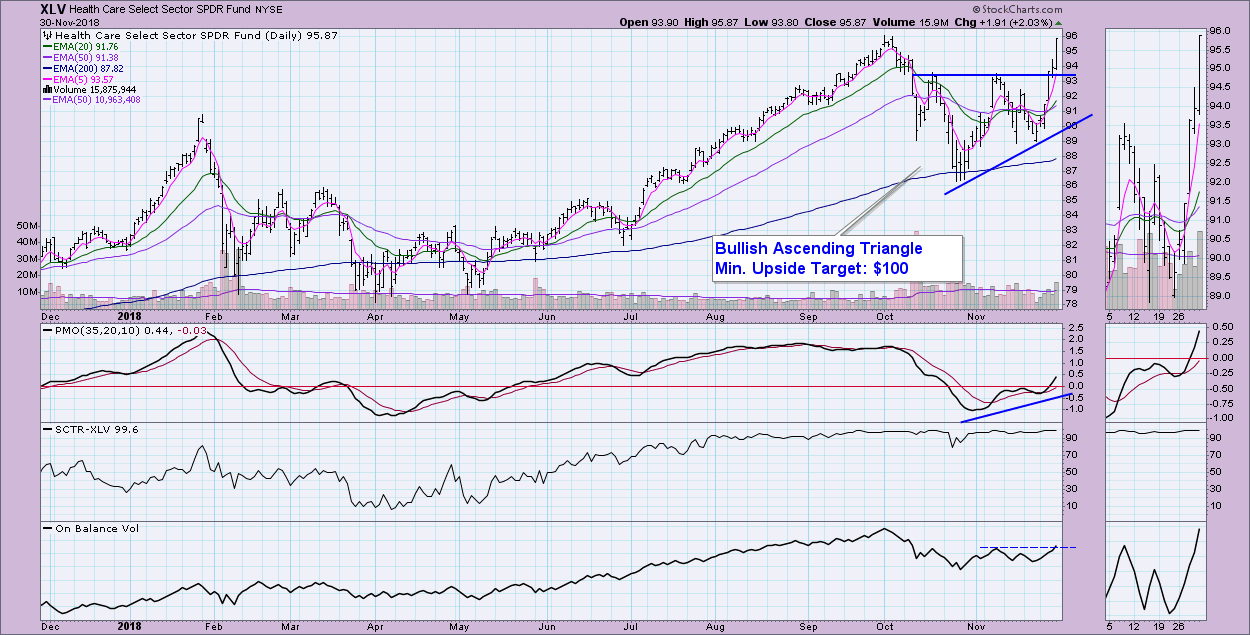
On Thursday, I pointed out that the bullish ascending triangle had executed. On Friday, we saw a rally pop of over 2%, which set a new all-time closing high for XLV. If you do the measurement of the back of the triangle and add it to the breakout point, we get an upside target around $100. The PMO is showing a bullish confirmation and the OBV has risen above its previous top.
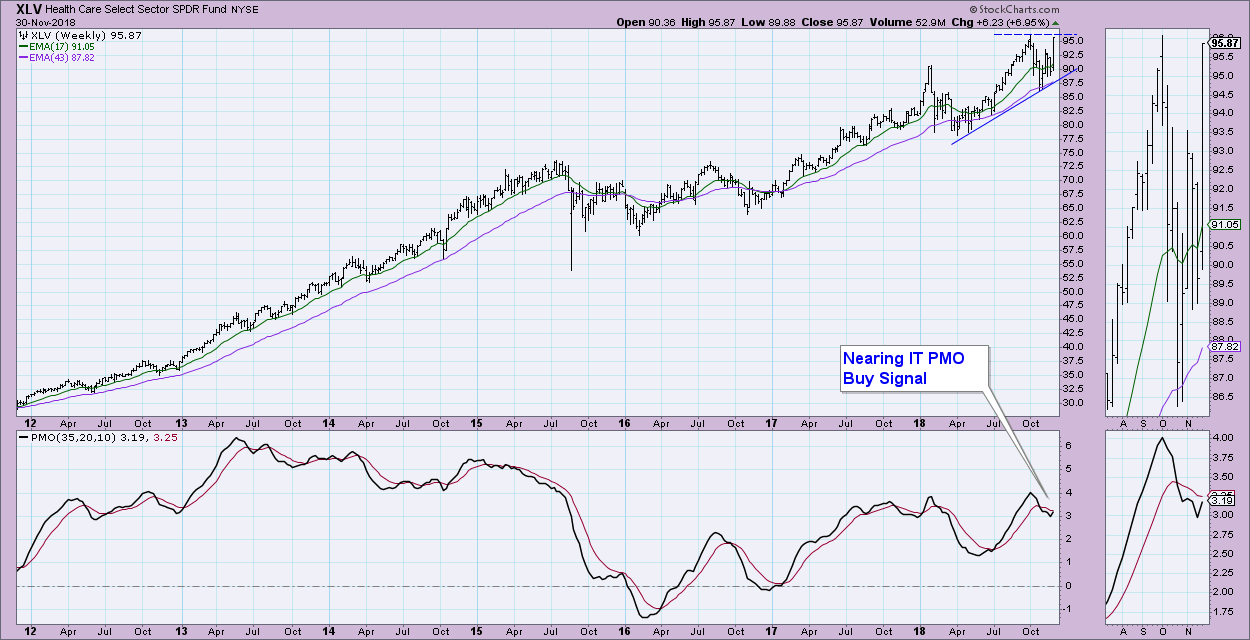
The PMO on the weekly chart is about to trigger a new PMO BUY signal.
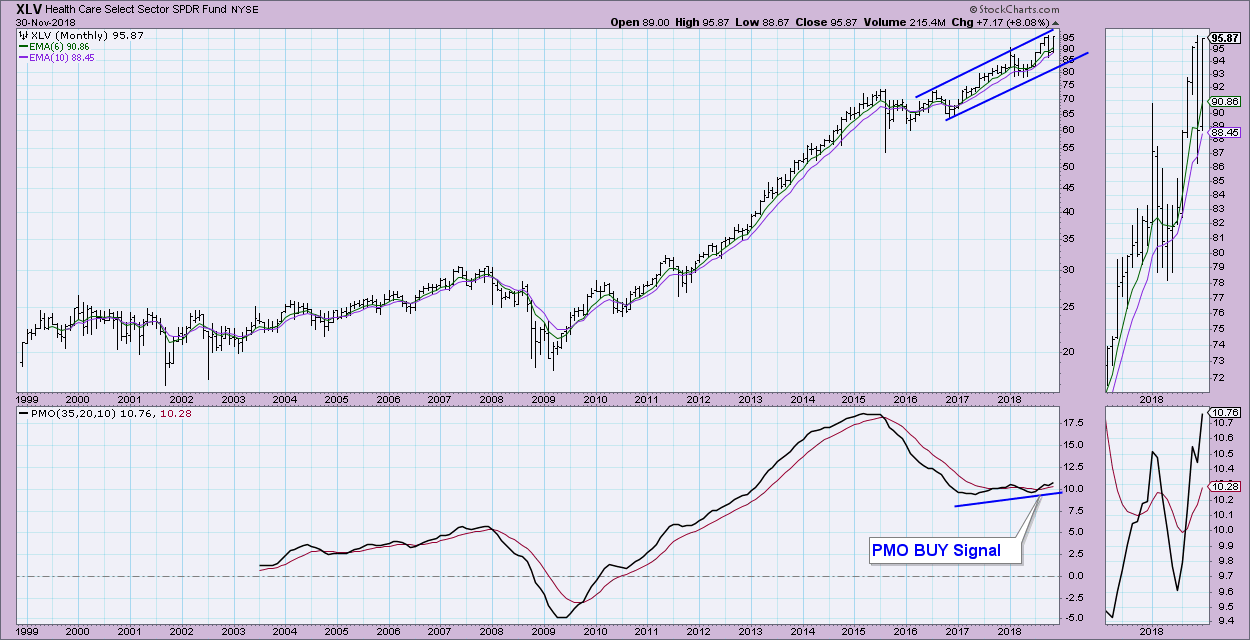
On the monthly chart, we can see a strong rising trend channel and a PMO BUY signal. The PMO has surpassed its previous top and is not at all overbought. We also have a bullish confirmation, with PMO bottoms rising with price bottoms.
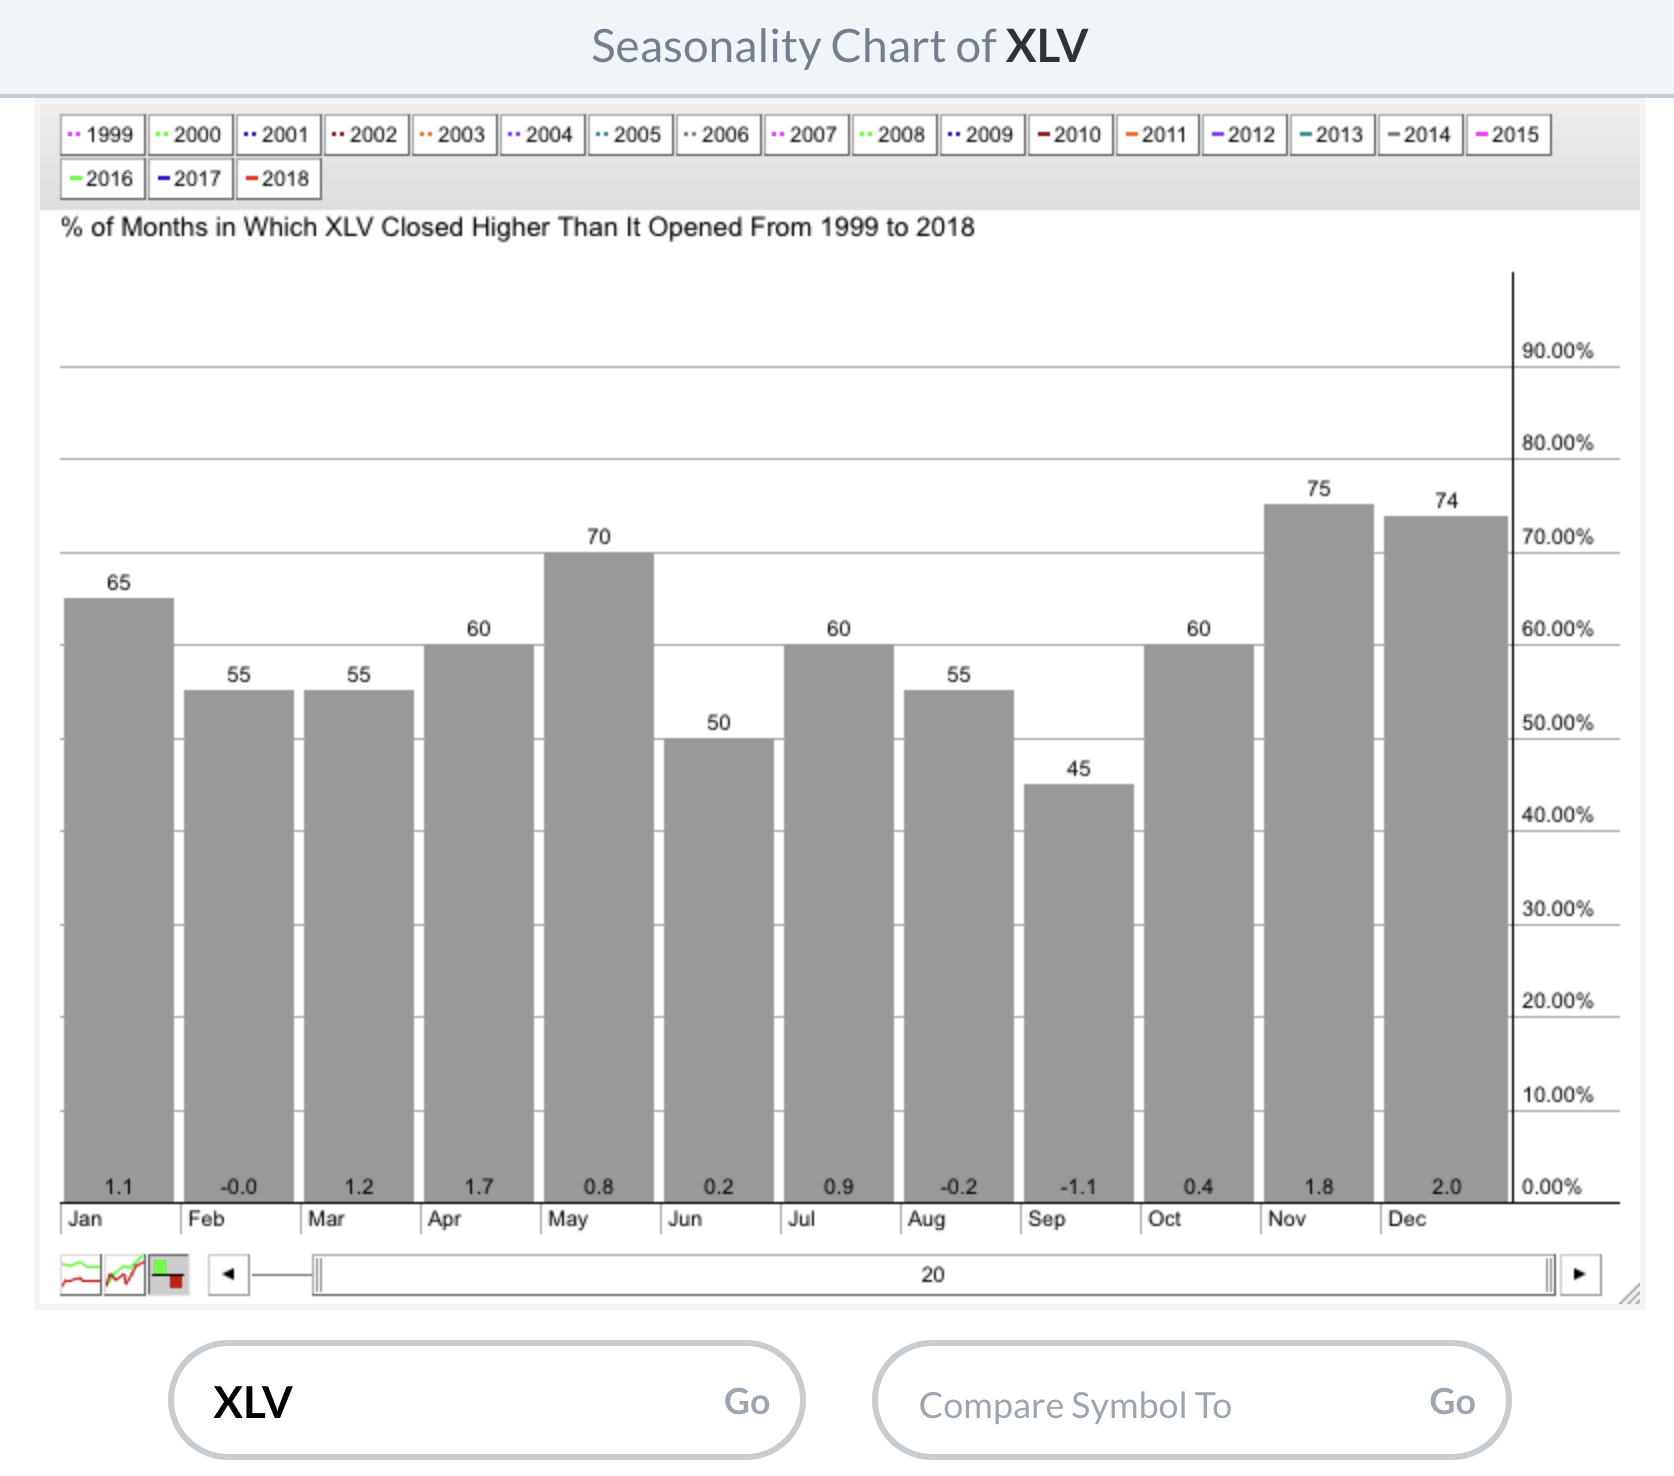
To punctuate this article, I decided to throw in the seasonality chart for XLV (Tom Bowley is rubbing off on me!) and you can see that XLV is still in a bullish seasonality period that should continue through the end of December.
Conclusion: Despite bear market sign posts on the large-cap indexes, the Healthcare sector remains strong. If I were trading right now, this is the sector I would scan for investment opportunities.
Helpful DecisionPoint Links:
DecisionPoint Shared ChartList and DecisionPoint Chart Gallery
Price Momentum Oscillator (PMO)
Swenlin Trading Oscillators (STO-B and STO-V)
Technical Analysis is a windsock, not a crystal ball.
Happy Charting!
- Erin
**Don't miss DecisionPoint Commentary! Add your email below to be notified of new updates"**