In a sense, it already has. Well, maybe not 16 straight years, but play along.
I've done a lot of historical stock market research over the years and several patterns really stand out. But one in particular always keeps me on edge as a short-term trader. The week after options expiration generally is not good. Over the past 7 decades, here is the S&P 500 annualized return by calendar day of the week:
Mondays: -14.82%
Tuesdays: +10.12%
Wednesdays: +20.09%
Thursdays: +10.51%
Fridays: +17.32%
Mondays have always been a rough day for U.S. stocks. They rise less than 49% of the time, which compares unfavorably to the 53%+ success rate that the S&P 500 has enjoyed on all trading days since 1950. But let's compare the overall annualized returns by calendar day shown above to the annualized returns by calendar day of the week following options expiration Friday:
Mondays: -38.99%
Tuesdays: -4.88%
Wednesdays: +25.21%
Thursdays: -2.28%
Fridays: +6.89%
If we combine all five calendar days, the week following options expiration Friday has produced annualized returns of -2.61%. Maybe this doesn't seem like a big deal to you, but these five trading days have occurred in every month for 70 years. They represent nearly 4000 trading days, which is roughly 16 years. If I told you that the S&P 500 would decline 2.61% per year from now until the year 2036, how excited would you be to invest? That's the performance equivalent of owning stocks the week following options expiration Friday.
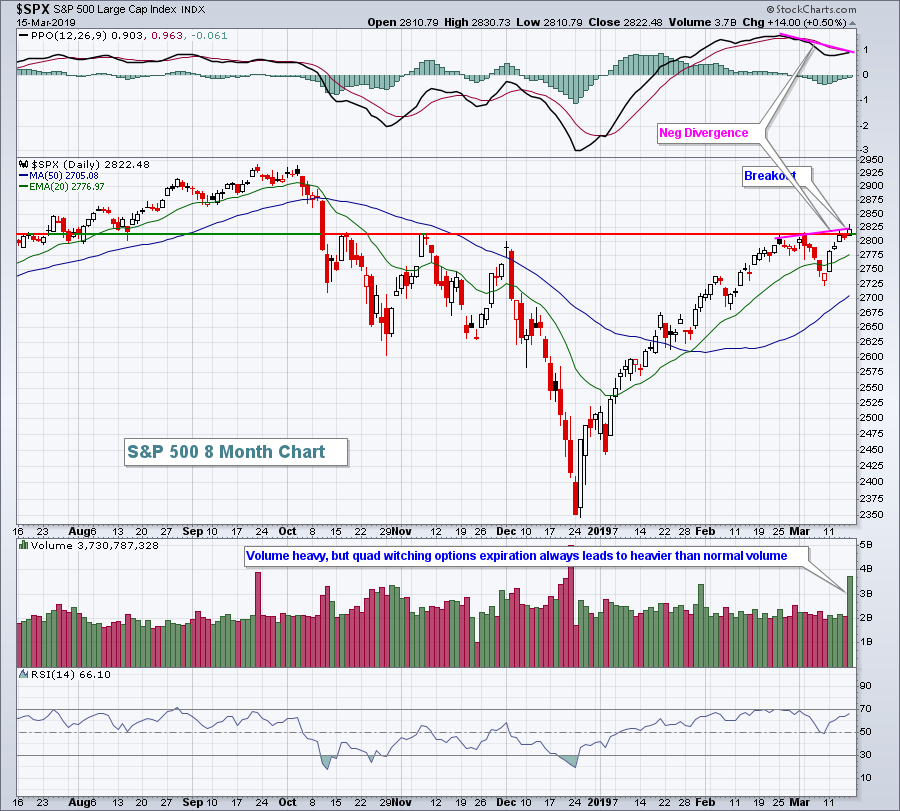
Does the market always lose ground the week following options expiration Friday? Of course not. Next week might be a stellar week, but knowing the stock market's tendencies is one step to becoming a better trader. The S&P 500 managed to close above 2817 for the first time since early October - a technical positive, but there's a negative divergence in play on the daily chart so if this breakout fails to hold, you might consider the long-term tendencies discussed above. Here's the current S&P 500 chart:
 I put much more emphasis on technical conditions than I do on historical tendencies, but I do feel that the risk of trading on the long side is much greater the week after options expiration. Building cash ahead of it is typically a good idea.
If you enjoy historical tendencies, make sure you subscribe to my Trading Places with Tom Bowley blog. In addition to much technical analysis, I feature a Historical Tendencies section where I discuss one interesting historical or seasonal fact about the stock market each day. Friday's article, "Transports Going Along For The Ride" highlighted the bullish market tendencies on Fridays. Follow the link provided and then scroll down to the bottom of my article. Enter your email address in the space provided and click the green "Subscribe" button. Once subscribed, my articles will be sent to the email address provided as soon as they're published!
Happy trading!
Tom
