Chip Anderson

September 2012

Chip Anderson

Scan Validation, Thicker OHLC Bars, and New Step-by-Step Articles

by Chip Anderson

We've been busy working on a bunch of things during the past couple of weeks.  Today we released several of the smaller items.  (We're saving the really big one for next weekend!)  The updates include: A new button on the scan results that shows you a chart based on your scan's indicators Thicker OHLC and HLC bar charts A whole seriers of Step-by-Step blog articles that will appear over the course of this weekend Extra and PRO users will now see that a red icon has been added to their scan results in addition to the three icons they were familiar with.  This is Read More 

Chip Anderson

What the Heck Have We Been Talking About? Also, What's a Wordle?

by Chip Anderson

Just for fun, here are some "wordle" images for several of our popular blogs.  A "wordle" is an image created by a computer program from the commonly used words in recent blog articles arranged in a interesting - but somewhat random - manner.  Enjoy! - Chip Chip Anderson: Don't Ignore This Chart: Art's Charts: ChartWatchers: The Canadian Technician: and The Traders Journal:   Read More 

Chip Anderson

Fixing Data "Mistakes" with our User-Defined Index Feature

by Chip Anderson

I've written a couple of articles already about our new User-Defined Index (UDI) feature that PRO users currently have (and that we hope to expand to Extra users soon).  The ability to upload time series data and then chart it with our tools is very powerful but here's one of the simplest things you can do with it - you can correct "mistakes" in our data. We work very hard at providing accurate data for our charts and, from our perspective, our data is as accurate as it can be.  It is verified and validated against multiple sources before it is posted.  If Read More 

Chip Anderson

When Shifting to the Right is Wrong - the DPO Indicator Controversy

by Chip Anderson

(Here's a repeat of an article I wrote in 2010. The information is still relevant today - and the controversy still rages -  Chip) 
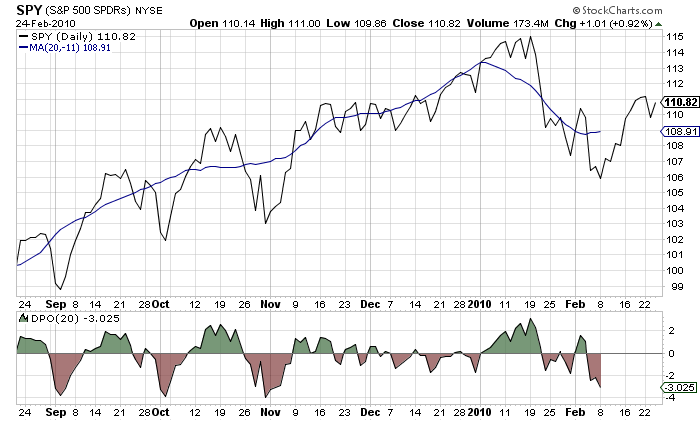
Yesterday, we received a question about our Detrended Price Oscillator (DPO) calculations.  The reader wanted to know why our DPO values for SPY where completely different from the DPO values provided to him by two competing websites - FreeStockCharts.com and VectorVest. The reader was nice enough to provide pictures of the charts he was looking at and sure enough the DPO values were very different from ours.  Not only that, but the entire Read More