
|
 Today I am thrilled to annouce that Martin Pring will be joining StockCharts.com as an official market analyst starting next month. In case you don't know (how could you not know?), Martin is the author of numerous books on Technical Analysis including "Technical Analysis Explained" and "Introduction to Technical Analysis." He has been speaking to audiences about technical analysis for decades. He is also the creator of the popular "Know Sure Thing (KST)" indicator. Martin's market insights compliment those of our existing analysts - John Murphy, Arthur Hill, Greg Schnell, Carl Swenlin and Erin Heim - perfectly. His wisdom and decades of experience means that StockCharts will continue to be the place on the Internet for high-quality, educational, useful market analysis based on technicals.
Once things are fully up-to-speed, Martin will be posting in-depth market commentary and videos regularly for StockCharts members to read. He will also be contributing to our free, twice-monthly newsletter. For now, I wanted to give you a taste of the kind of commentary Martin will be providing to members. Enjoy!
- Chip
Martin Pring's Market Roundup
April 23rd, 2014 Headlines:
- Stocks break down big time against commodities
- IGE/XLP (Inflation/deflation ratio) breaks in favor of IGE
- Brent Crude close to a major breakout
- Industrial metals with the exception of copper break to the upside.
- Spider Metals and Mining (XME) close to major upside breakout
- Energy Relative Strength starting to improve
- Coal has been a laggard but that is likely to change
Read on for details.
- Martin
Stocks Break Down Big Time Against Commodities
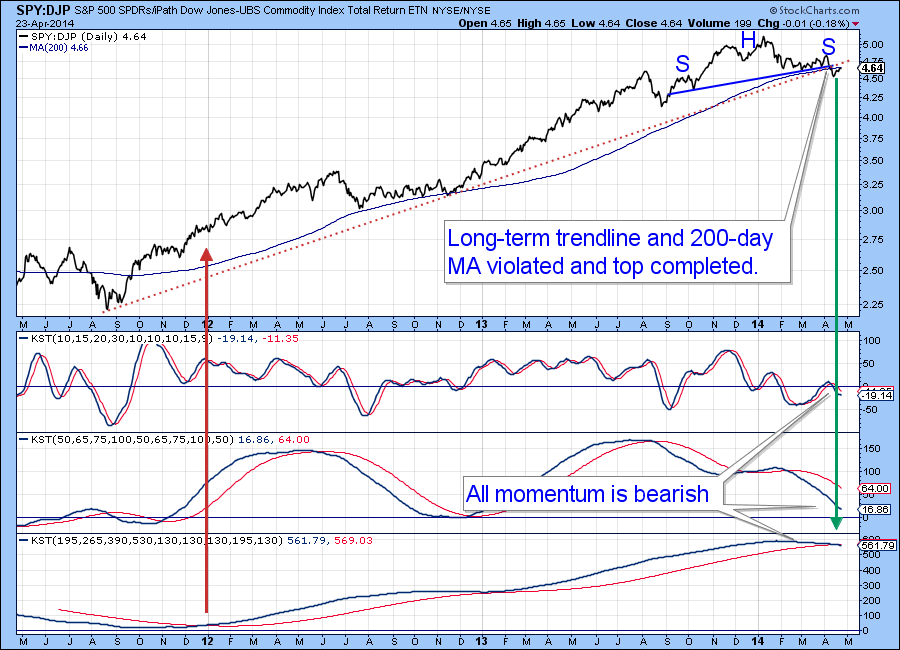
A major character change is taking place in the inter asset ratio between stocks (SPY) and commodities (DJP). In this respect Chart 1 shows that the ratio has violated its bull market trendline, its 200-day MA and completed a head and shoulders top. Its short- intermediate and long-term smoothed momentum, in the form of the KST takes up the rest of the space in the chart. These series reflect the short-term (2-6-weeks), intermediate (6-weeks-9-months) and primary (9-months-2-years) trends. Each is in a bearish mode. Near-term that suggests that the ratio is likely to fall further, meaning a more decisive penetration of the trendlines. The rolling over action of the long-term KST is more indicative of a major trend reversal in this relationship. Since the market low in October 2011 stocks have been the only game in town. That appears to be changing as commodities and commodity driven sectors of the equity market are likely to out- perform. The implications are therefore huge for the various stock market sectors.
IGE/XLP (Inflation/deflation ratio) Breaks in Favor of IGE
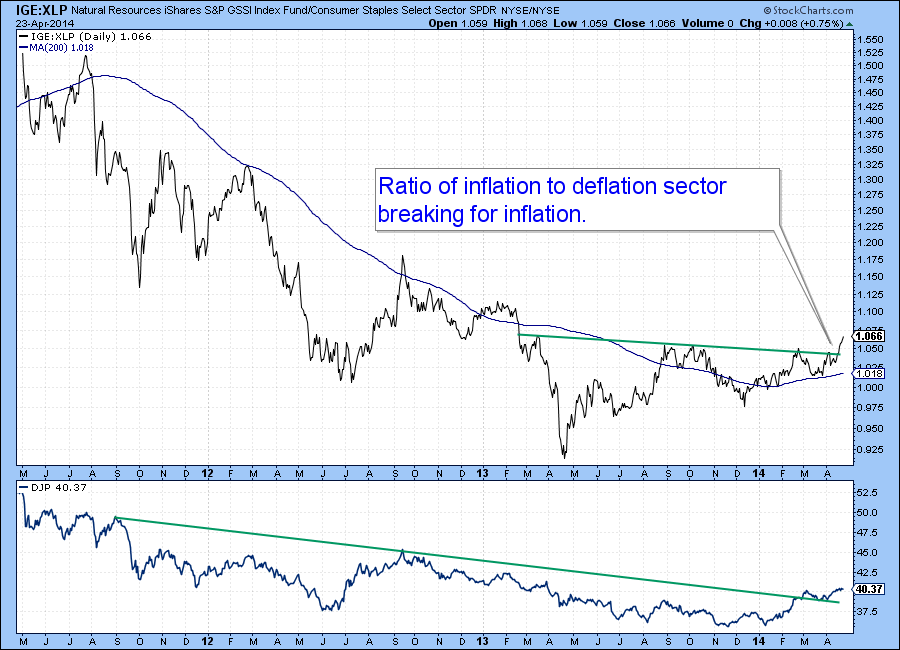
Chart 2 shows the ratio between an inflation beneficiary, the Goldman Sachs Natural Resource and a defensive sector, the Spider Consumer Staples, the IGE versus the XLP. Its movements correspond to those of the Dow Jones UBS Commodity ETN, the DJP, which has been plotted in the lower window. Both series have broken to the upside. This is really the stock market’s way of voting in favor of inflation sensitive stocks compared to defensive issues. In other words, for resource based areas, like energy mines and basic materials ,and against defensive areas that have done so well since 2011. These would include health care, consumer cyclicals and financials. It says nothing about whether these defensive sectors will go up or down, merely that they will be out performed by the IGE.
Brent Crude Close to a Major Breakout
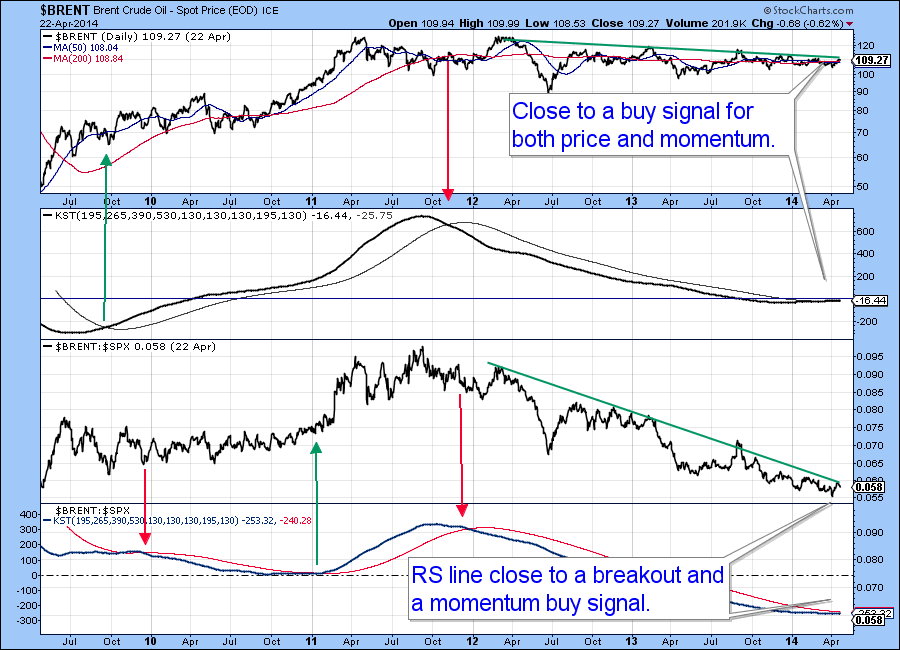
Chart 3 features Brent oil together with its relative action against the S&P. Long-term KST’s for both price and relative action against the S&P Composite are shown as well. The red and green arrows indicate that when the KST crosses its MA useful long-term momentum buy and sell signals are triggered. The strongest long-term signals develop when both KST’s reverse to the upside from below zero and cross above their MA’s. That has not yet happened but, based on their current trajectories, they look like they soon will. Right now both Brent itself and the RS line are just below key down trendlines and since their momentum series are poised for an upside breakout some major signals could be in the cards. The breakouts in the first two charts suggest Brent will soon follow suite.
Industrial Metals (except Copper) Break to the Upside
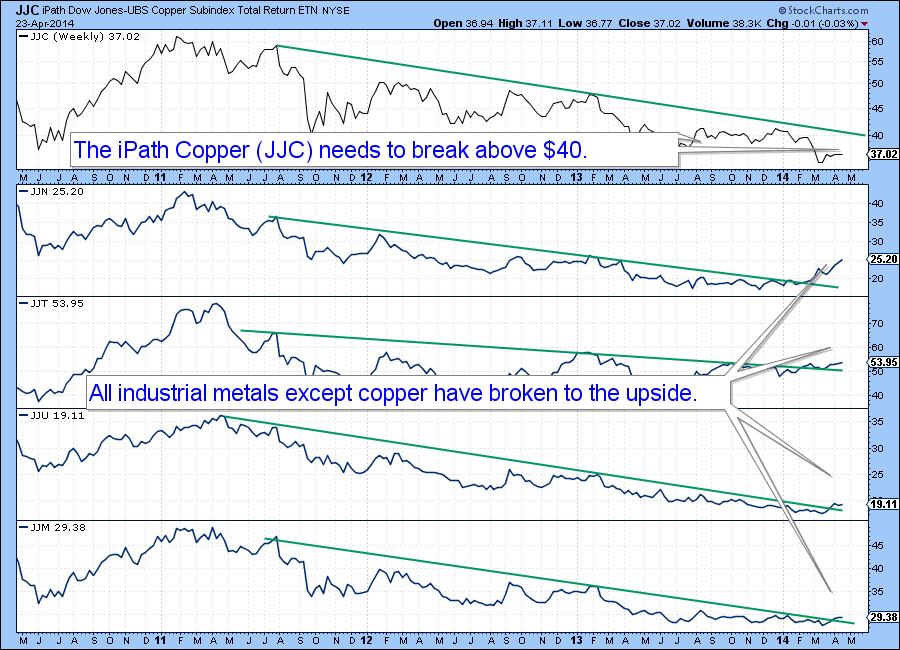
Chart 4 shows four industrial metals along with the ipath Dow Jones Metal ETN, the JJM. All except copper have violated key down trendlines suggesting that metals, yes even copper, are eventually headed higher. Be careful with the JJT (Tin), JJU(Aluminum) and JJN (Nickel). They, along with the JJM itself, are not the greatest in terms of liquidity.
Spider Metals and Mining (XME) Close to Major Upside Breakout
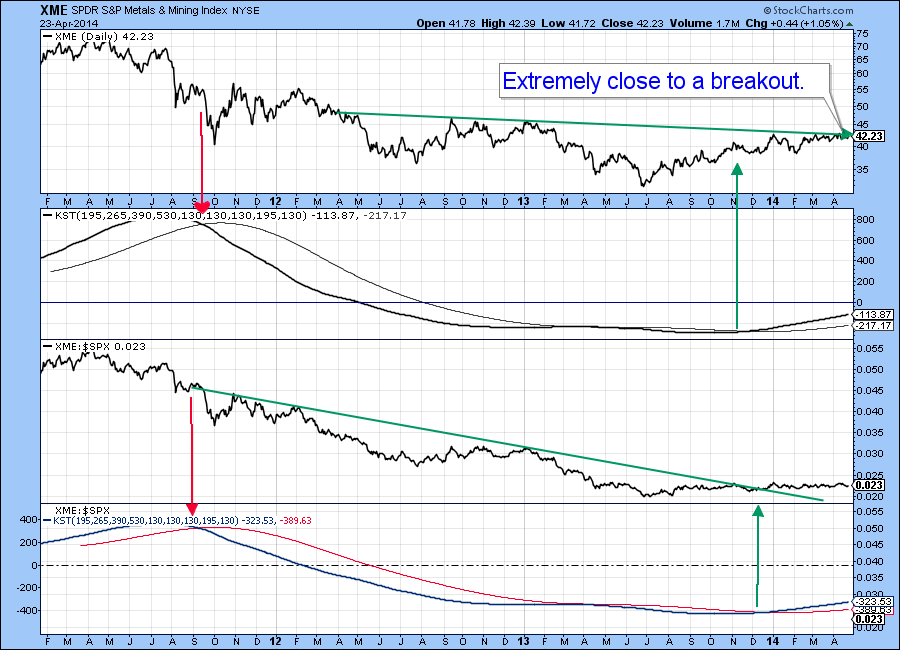
Turning to the stock market we find that the two momentum curves for the Spider metals and Mining ETF (XME) in Chart 5 are both bullish . The RS line looks as if it’s headed higher and therefore likely to out- perform the S&P. The price itself, despite the positive momentum has yet to break above its resistance trendline. I think it eventually will.
Energy Relative Strength Starting to Improve
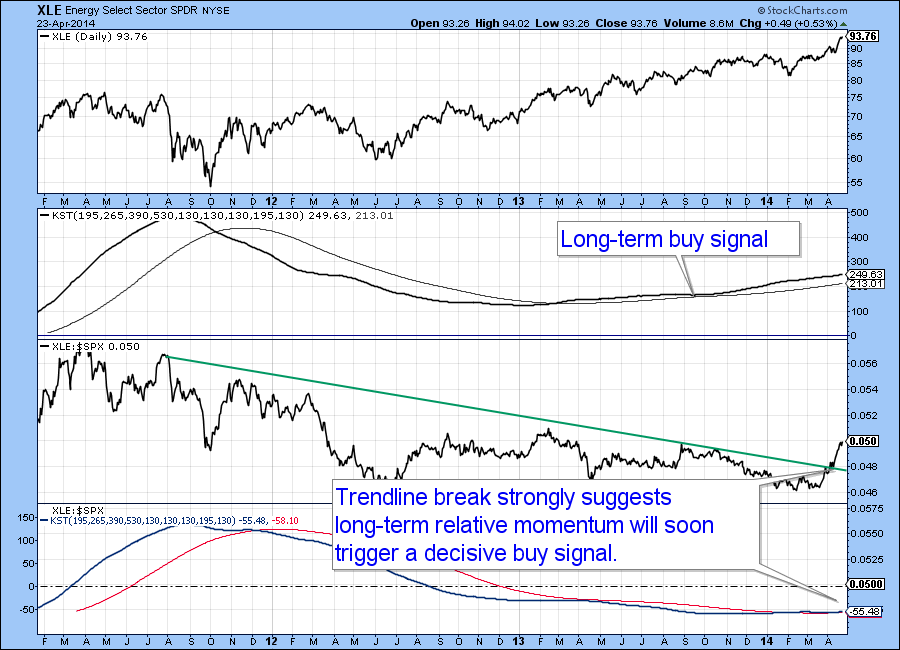
Energy (XLE) has been in an uptrend for some time as Chart 6 shows. However, the relative action has only recently broken out and that should mean the long-term KST for RS action will soon join it in the bullish camp.
Coal has been a Laggard but that is Likely to Change
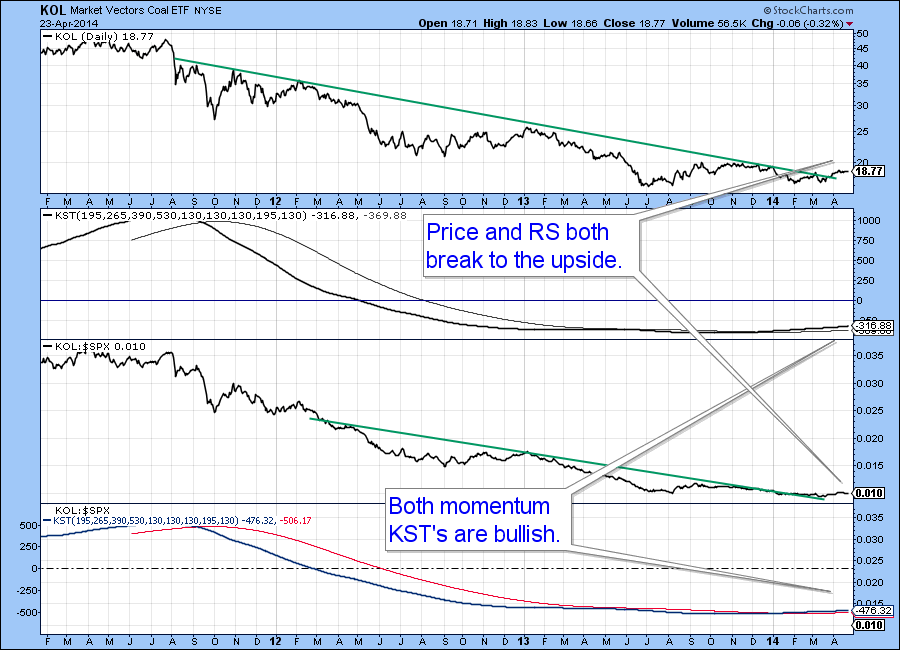
The much maligned coal sector has been an energy laggard but Chart 7 suggests that that is about to change as both the price of the market Vectors Coal ETF (KOL) and its RS line have both broken out and this is supported by long-term KST action.
And that's the market roundup for today,
- Martin

Posted by: Erik Wessling April 28, 2014 at 22:10 PM
Posted by: Dan Nussberger May 02, 2014 at 12:46 PM
Posted by: Riccardo Scuratti May 07, 2014 at 03:23 AM