
|
We've just added a parameter to our "Volume by Price" overlay - it didn't have any before now - that allows you to set the number of horizontal histogram bars on the overlay.
In case you haven't used it before, the Volume by Price overlay is a collection of horizontal histogram bars that show you how much volume has accumulated at different price levels on your chart. It is great for finding and confirming support/resistance zones.
Here's a traditional, "old-school" Volume by Price chart:
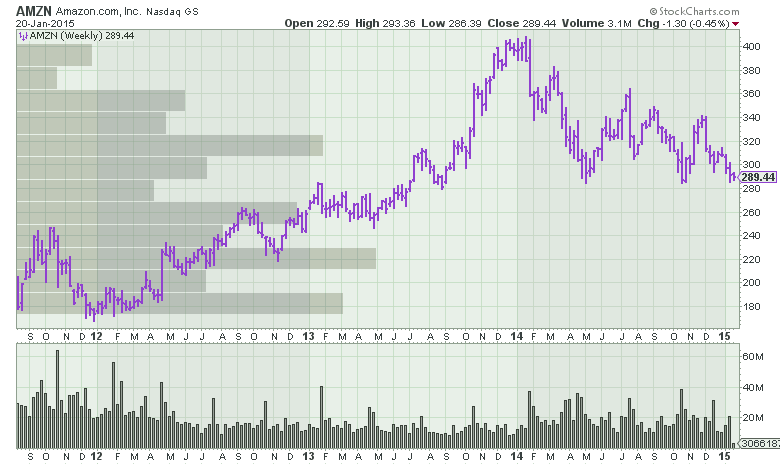
(Yes, you can click on the chart to see a live version.)
Note that there are 12 histogram bars stacked vertically on the chart. If you scan over the to right edge, you'll see that the upper most bar happened around the 310-320 area - hard to be more precise with this view.
Now, here's an example with 24 histogram bars:
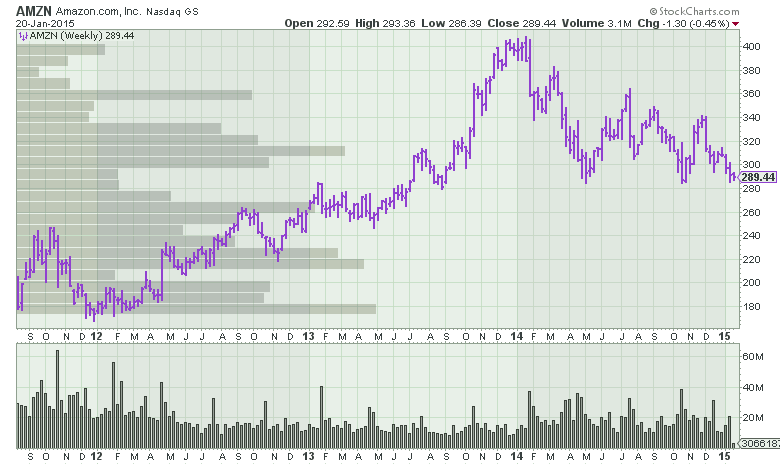
Notice how the upper-most peak has been narrowed down to the 315-318 area.
And, for the crazies out there, here's one with 100 histogram bars:
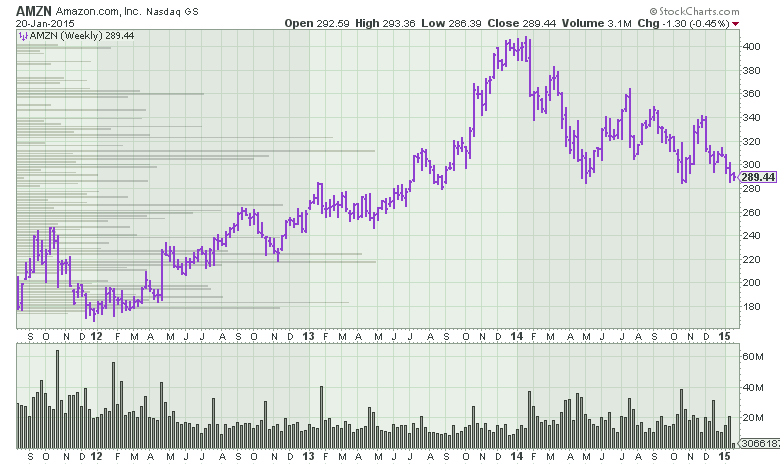
Definitely not recommended but... what the heck? Go nuts.
- Chip

Posted by: Richard Knutson January 20, 2015 at 18:01 PM
Posted by: Jim Bock January 21, 2015 at 09:21 AM
Posted by: Kyle Coon January 21, 2015 at 09:45 AM
Posted by: Ralph Folden January 21, 2015 at 11:39 AM
Posted by: steve B January 21, 2015 at 14:17 PM
Posted by: Jim O January 21, 2015 at 14:19 PM