Commodity related stocks had a ridiculously bad day by any sort of measure. Gold was up $18 and the GDX hardly budged. Oil stocks have been unable to rally this week with crude oil testing a small breakout, only to reverse. The Metals ETF broke a year long trend line today. The Uranium related ETF broke the 2017 trend line. The Copper ETF broke its trend line. The Steel ETF keeps struggling at resistance.
The big picture question for me: If Commodities can't get any love in a big roaring bull market, when are they going to get some? Based on today's failures across the board, soon doesn't appear to be one of the options.
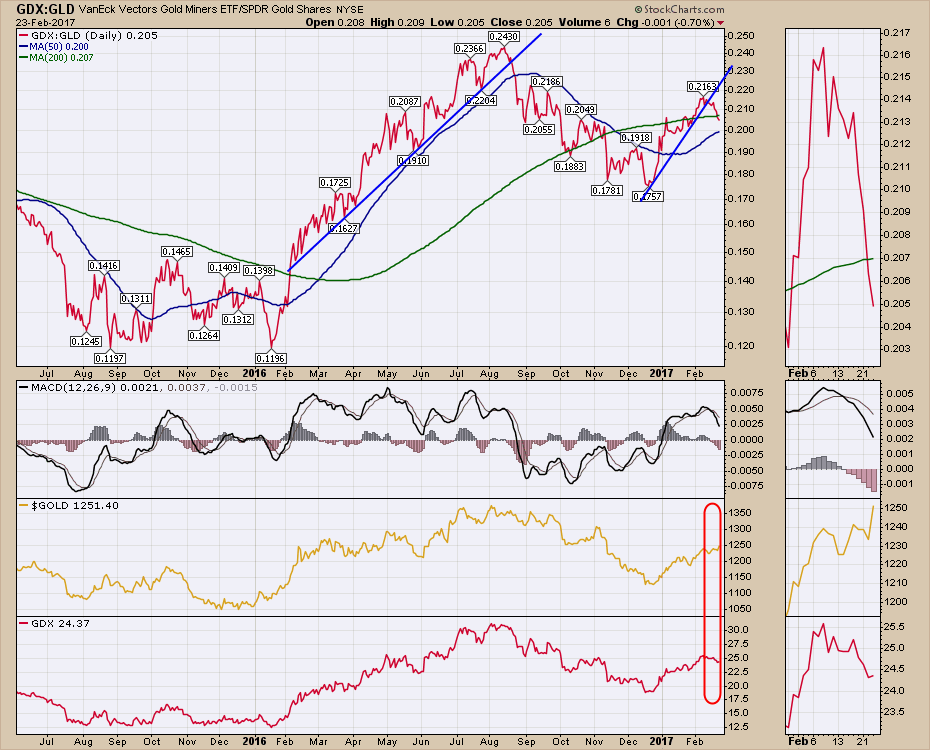
In the primary pane below, the Gold stocks:Gold ratio (GDX:GLD) has broken its trend line and was a pretty good sell signal in August. Today's action is easy to see in the zoom panel. Gold up sharply, no response from the miners. Extreme caution is warranted.
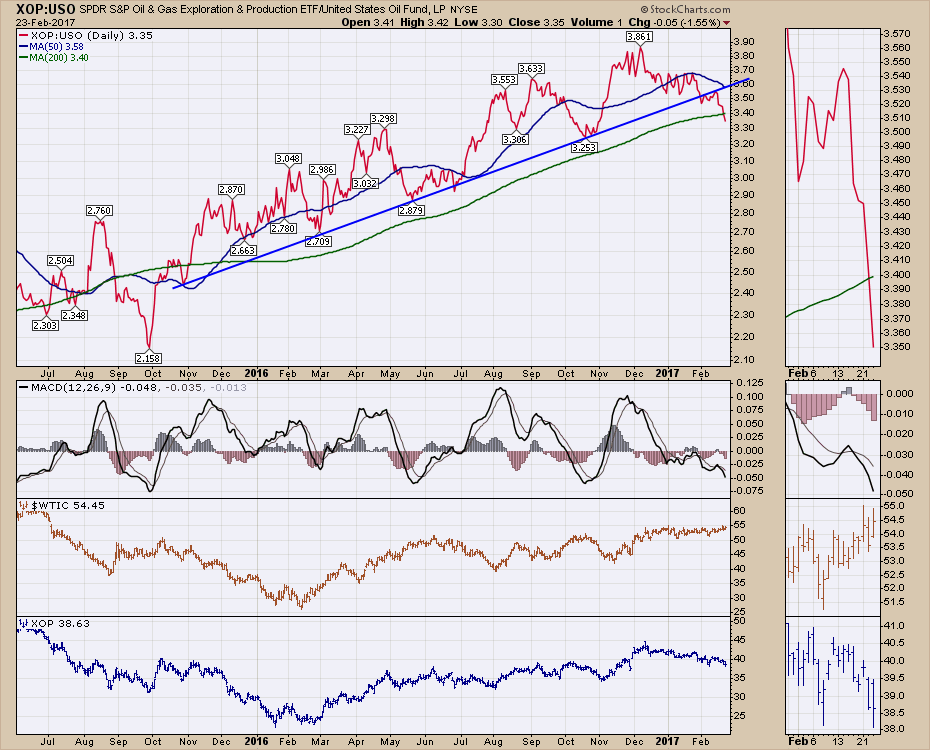
Same holds true for oil and the exploration companies ratio. I used XOP:USO. Notice $WTIC in the lower panel trending higher, the Exploration co's not so much. Look in the zoom box specifically.
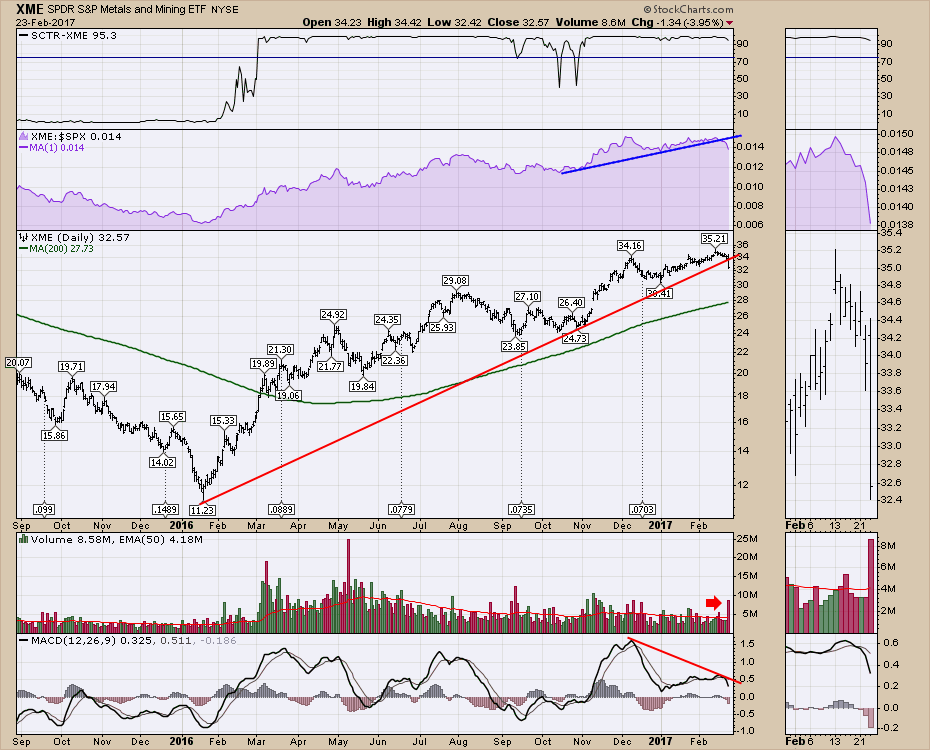
 The Metals ETF (XME) broke a year long trend line today. Volume response was more than double the average volume. More caution warranted.
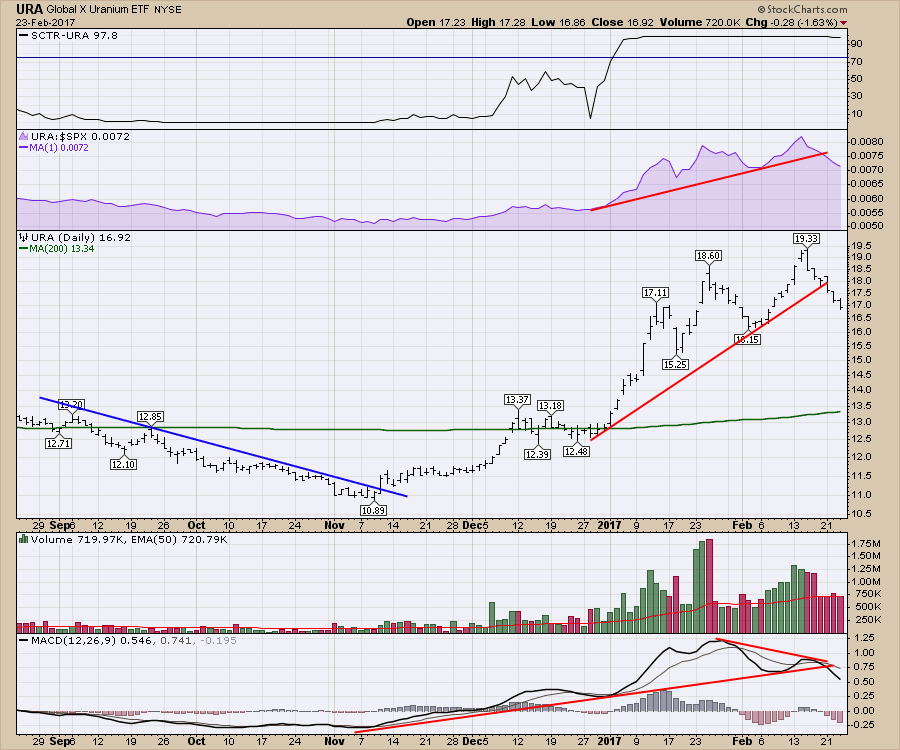
 The Uranium ETF (URA) broke a shorter trend but just another hole in the overall Commodities trend.
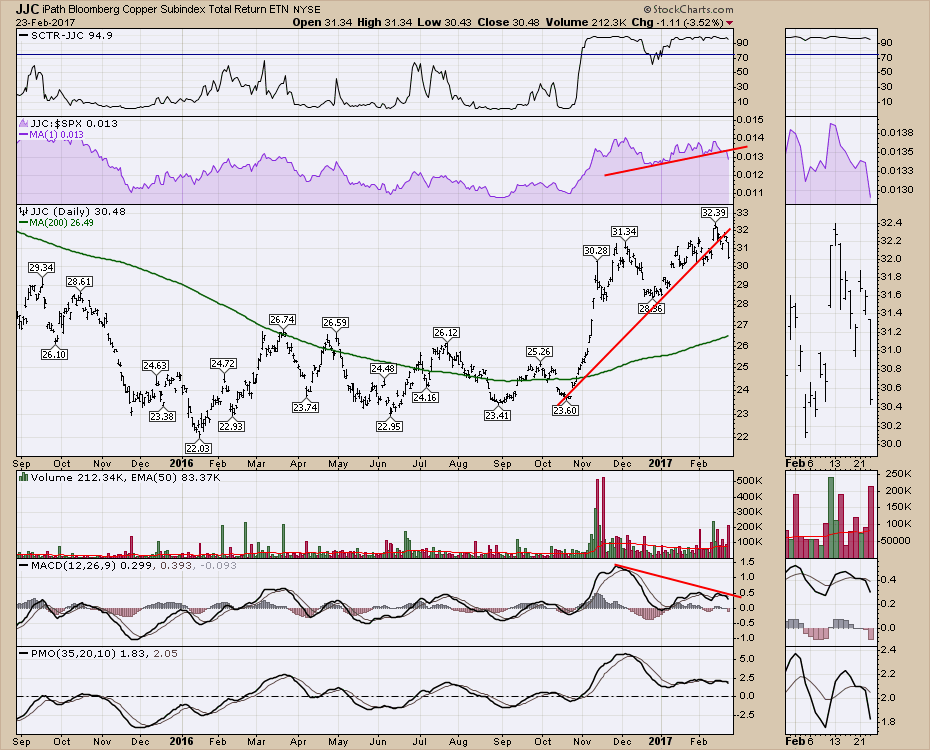
 Copper (JJC) has been range trading and recently tried to break higher. This looks a lot like a failed breakout above the range and a fall through the Trump trend line. Selling volume was pretty high today at 2.5x average volume.
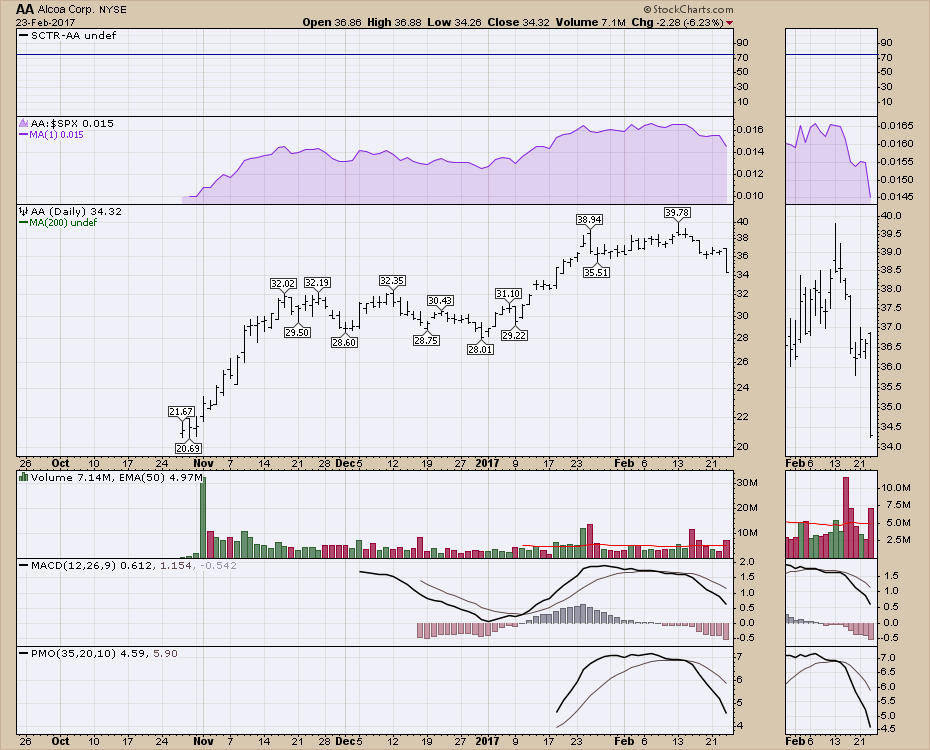
 The newly separated Alcoa (AA) , is trading down 15% from the highs after an aggressive surge from the split.
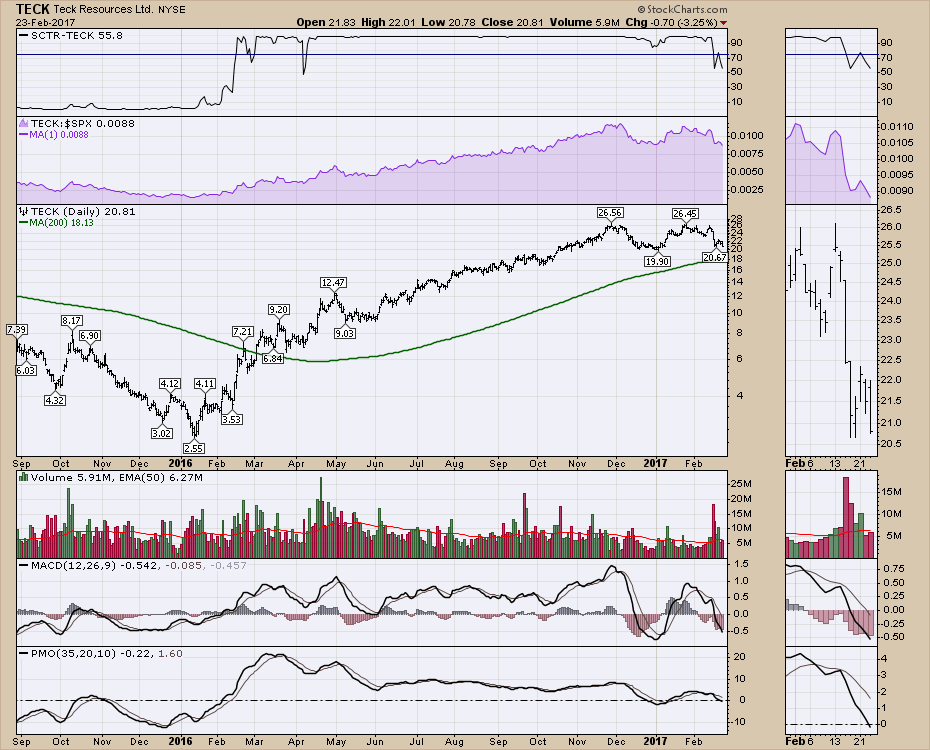
 FCX and TECK are down 20% in the last two weeks. Here is TECK after a 1000% rise; it has given up 200% of those 1000% gains. It has not made any real progress since late November.
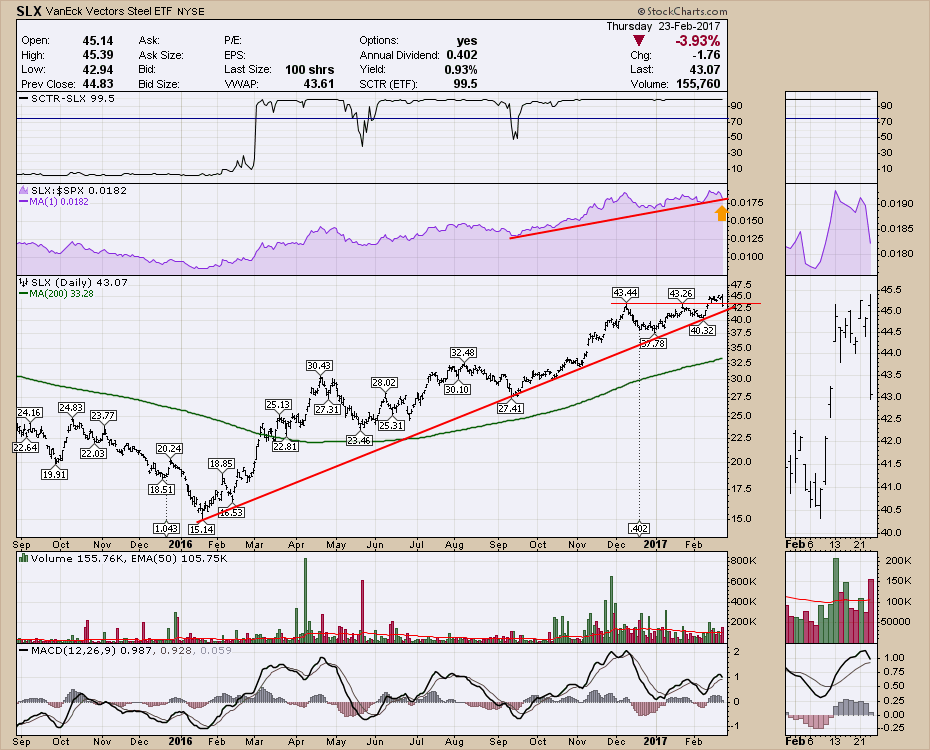
The Steel ETF (SLX) looks like a failed breakout today with a ~4% drop. Trend line support at $42 looks important.
 Just to round out the pain, We'll look at $NATGAS showing a significant shot at $2.50. This weekly chart shows the year long channel break last week. Horizontal support at $2.50 is in play. Last year, $NATGAS fell straight to the March 1 timeframe then accelerated from there. That would be next week so we'll keep watching.
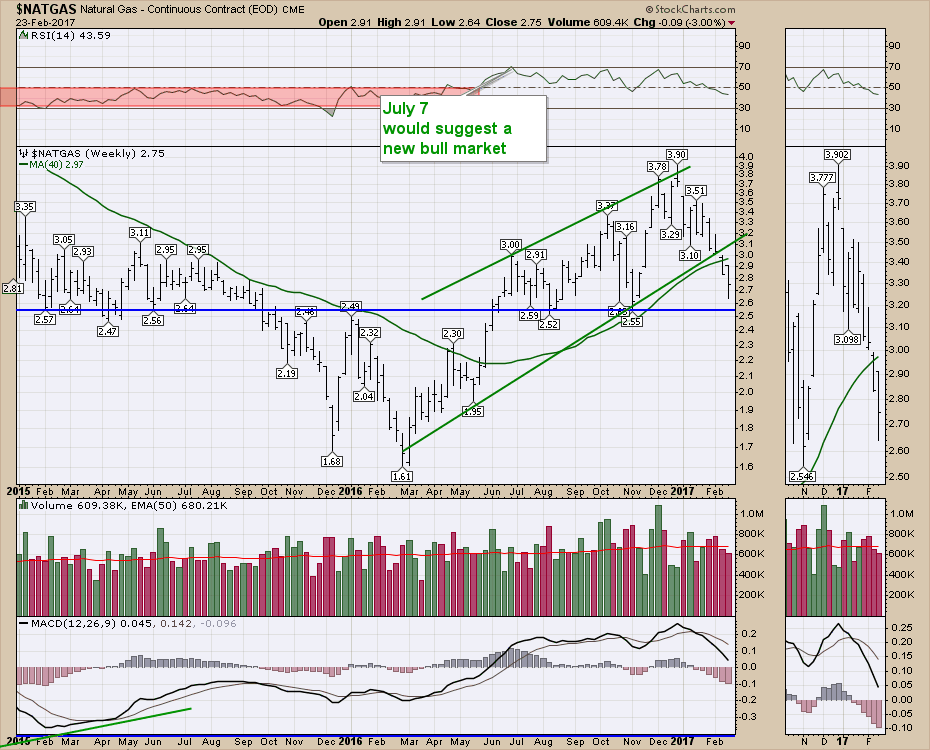
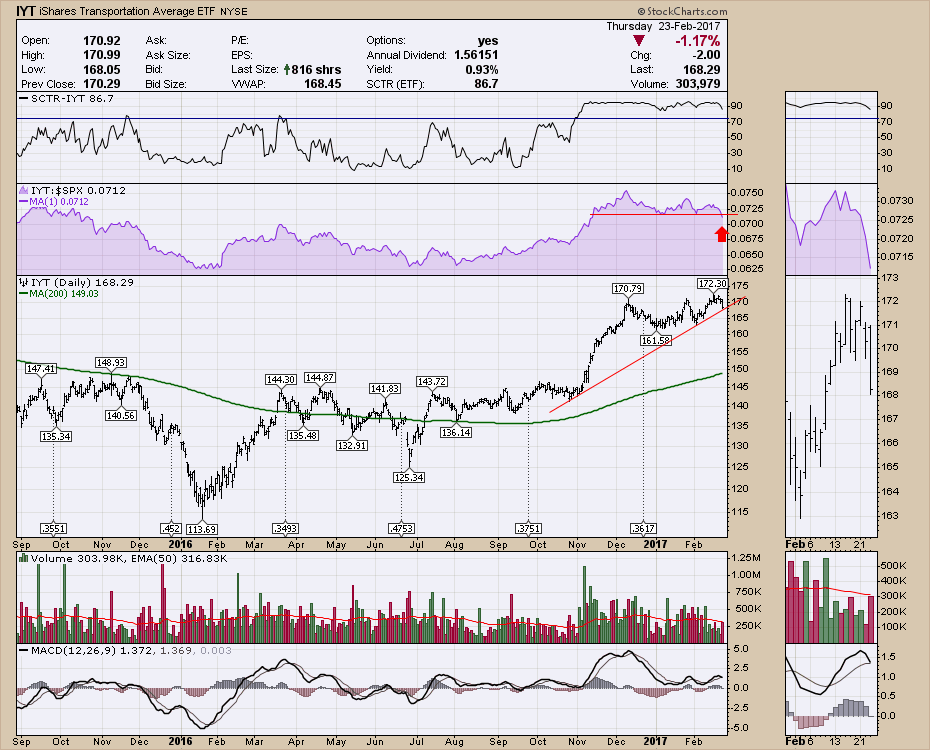
Lastly, we are starting to see the transports underperform. In my mind, that usually follows weakness in Commodities.
 Here is a link to the Commodities Countdown video.
Commodities Countdown With Greg Schnell 2017-02-23 from StockCharts.com on Vimeo.
The webinar covers off the dilemma in currencies, the rise in bond prices, the breakout in XLP and a 4 month high on Relative Strength today, the $CRB commodities, and a broad look at the big trend in Commodities. I'm sure you'll find more than a few ideas to ponder as this was a wicked day for Commodity trends being broken.
For the educational segment, today illustrates why Technical Analysis can hold a significant piece of information for investors when we use the four asset classes to do intermarket analysis. John Murphy's book Intermarket Analysis was a groundbreaking look at the markets and the relationships of trends to each other.
On the Commodities Countdown Video, I used the currencies to illustrate how the market was struggling in a range. All of the currencies are near some support or resistance, but we have range traded for a while. A break in these currencies will probably accompany a change in other asset class trends. The Commodities trend line breaks today appear to be suggesting that the $USD is going to break significantly higher and this will hurt Commodity related equities as well as Commodities. IF its a whipsaw we'll know in the next week, but breaks in trend have to be respected. The bond market prices are also making higher highs and higher lows after the big sell off. So that is a trend change as well. While the US equity market is still going higher, there is a significant change in the underpinnings of the markets. This usually feeds on itself to form a top and a change in trend in the equities performance.
One chart is a piece of information. But the larger market is a puzzle of various charts. Because everything has different price earnings ratios, price to book etc, fundamental analysis does not show when all these trends are breaking. It is important to be aware when a whole bunch of trends start to break at the same time. That does not follow into fundamental analysis. Today, grouping all of these charts together demarcates a date stamp of trend changes. February 13th-23rd lots of trend changes and failed breakouts.
We saw trend changes early in February 2016 when the Commodities all started to bounce the two weeks before. We also saw this high correlation of signals when the $USD soared in 2014 and all the Commodities fell hard. Today we are getting setup for the same types of signals all showing up within days of each other.
Let me summarize some of the charts in the video:
- Commodity Equities: Breaking down (AA,TECK,XOP,GDX,URA,APA)
- Commodities: trendline breaks in Copper, Natural Gas. Potential failed breakouts in Oil, Steel, Transports.
- Currencies: Euro testing the support at 105, the smaller Swedish Krona suggesting down is the right direction for the Euro, so that is my bias till proven wrong.
- Bonds: After being sold off, the prices are starting to make higher highs and higher lows.
- Defensive Sectors: XLP making 4 month Relative Strength highs today. XLU, XLV very close.
- Leadership Stocks TSLA, NVDA, MU, TECK, breaking down hard. 20% off the highs quickly.
- Transports: Starting to underperform with 3 month RS lows and a failed breakout on February 13.
- $RUT underperforming
So while some might not understand technical analysis fully, it is the ability to use charts on all four different asset classes across Industry groups to see trend changes. Technical Analysis is not about one chart. Technical analysis is about seeing changes in trends across a lot of charts at one point in time (a few days to a few weeks) that gives you a reason to understand the changes early on.
Today was a great day for technical analysts to put down the pencils and step back to see the macro environment changing. While it is still early and things may reverse, there should be no question that the next few weeks will be some of the most important in terms of watching the market for more clues. This is critical knowledge for technicians. It doesn't mean the absolute high is in. That may or may not come in the next few weeks. It does say that investors are changing their behavior, the trend is changing and technicians are getting the message. This is not the place to add to positions until we have more information.
If you are not a subscriber to StockCharts.com we are currently offering a one month free trial. Click here to find out more about why thousands of investors are turning to StockCharts.com to help them manage their money.Thank you for taking the time to study the commentary component of StockCharts.com. There is a whole lot more available for members.
Thanks for following my work. You can also follow me on Twitter @Schnellinvestor.
Good trading,
Greg Schnell, CMT, MFTA.
