Julius's de Kempenaer's RRG charts do a great job of visualizing the market rotation. The falling $USD made most investments in foreign markets do well. Some foreign markets have been dropping for three months in local currencies (France, Germany, Japan, Canada, Australia) but the charts priced in US Dollars made them look stellar.
With the dollar stabilizing the last few weeks, these foreign markets have fallen out of the leadership quadrant into the weakening quadrant. Japan is still in the green quadrant but pointed down. The Nikkei ($NIKK) made new 3-month lows on Monday in the local currency. The European markets have moved from leading to weakening. The real question is can they turn back up here?
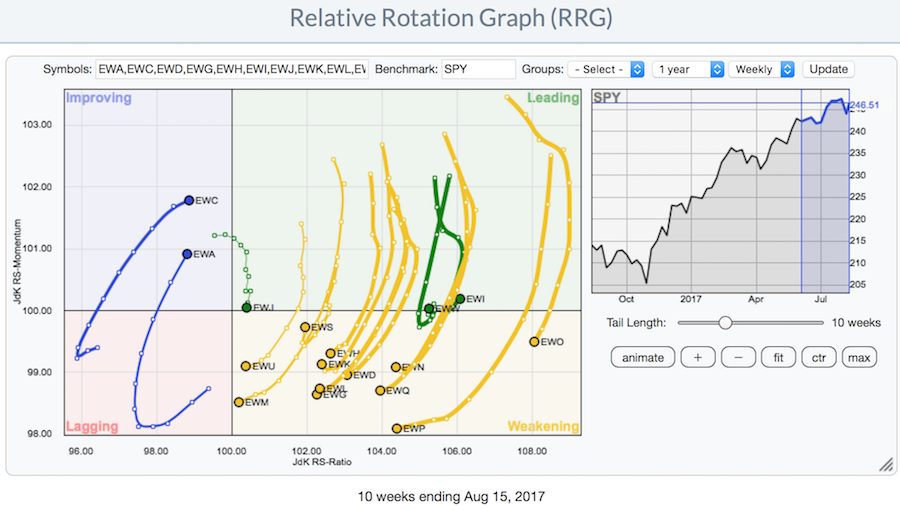
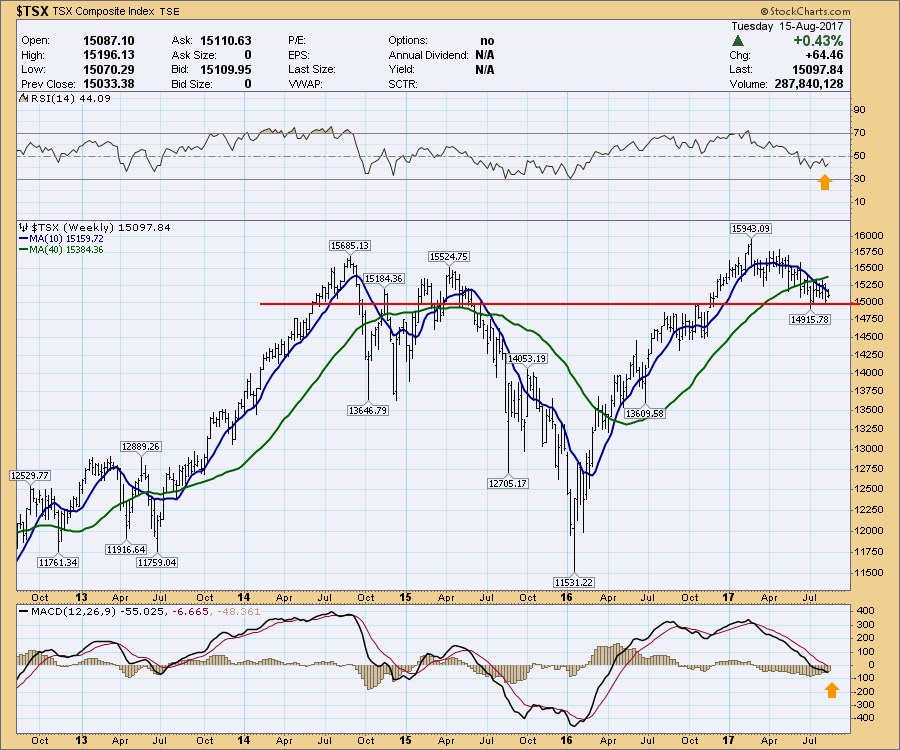
These charts are not extremely weak, but they have stopped rising months ago. Three charts are trying to move to the Northeast corner on the RRG. They are EWW for Mexico, EWC is Canada and EWA is Australia. All three are commodity countries and are trying to rally. The Canadian market in Canadian Dollars is still off the highs by 5%. Because of the falling US Dollar, it looks like Canada is improving. The Canadian $TSX chart looks weak but it is still 600 points above the November low.
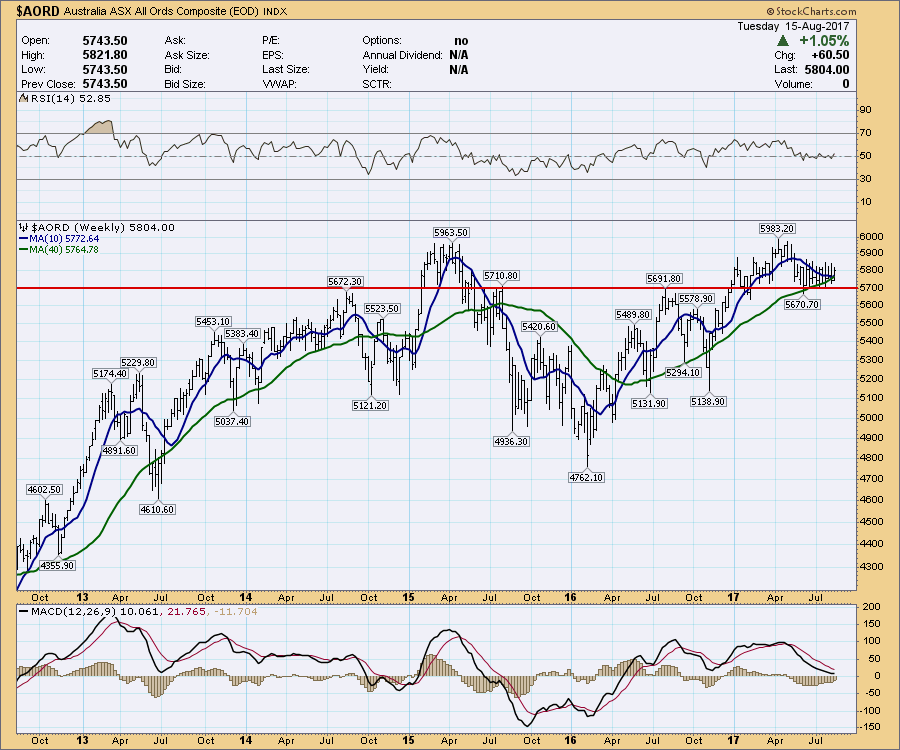
 The Australian market is in a tight range as well. The 5700 line in the sand looks pretty important!
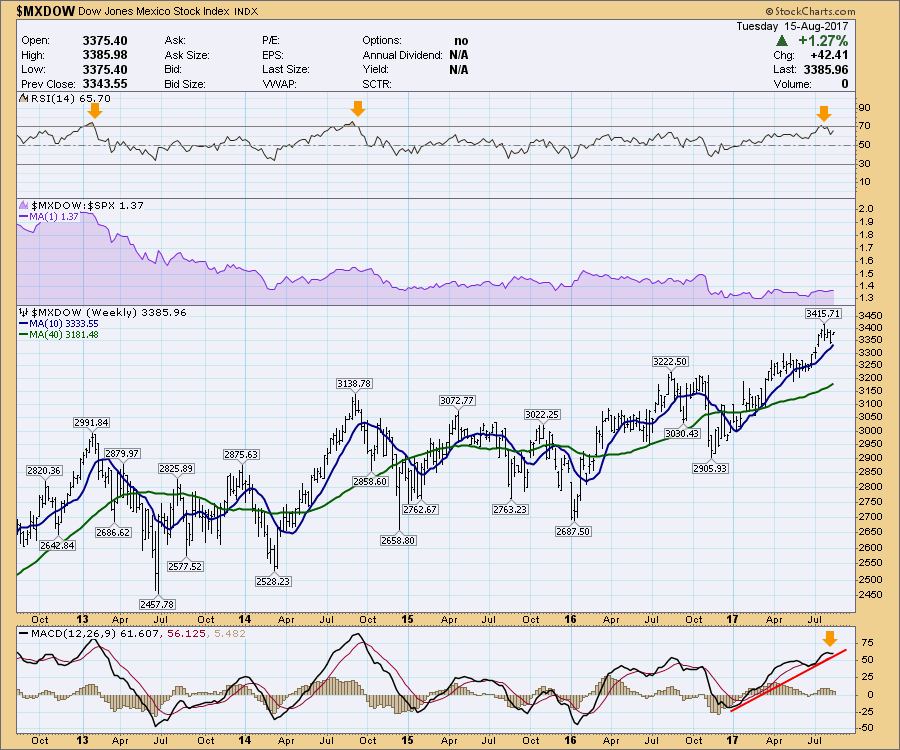
 Mexico also has an interesting chart in local currency. It looks like its flying, but the relative strength compared to the $SPX shown in the purple area chart, suggests an investment in the $SPX would be better. The EWW chart (not shown) looks great because it has the soft $USD making foreign markets look more attractive.
 The bottom line is that all of these foreign chart ticker symbols (EWW, EWA and EWC) are a $USD trade. If the market is rising in local currency and investors are getting the benefit of a falling dollar, thats a benefit for the investor. However, the $USD has recently had an RSI below 30 on the weekly chart.
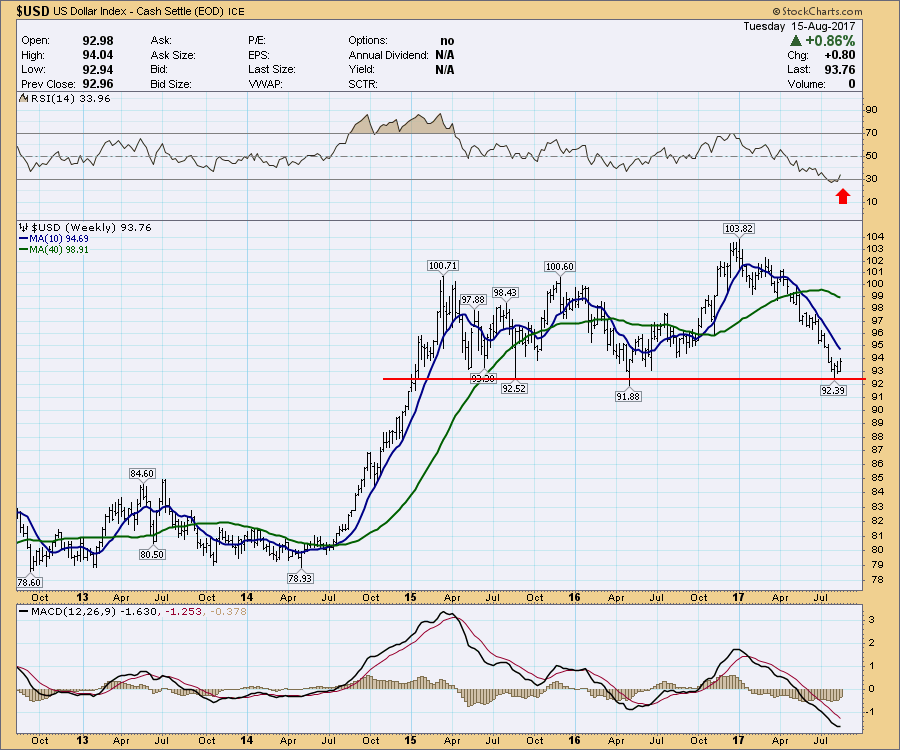 It looks like the $USD is pushing higher after bouncing off support. A 50% retracement would be about $0.06. This might imply that the foreign market charts are starting to feel some pressure, and US investors hanging out in these foreign market ticker symbols listed in the RRG chart above should be cautious. That caution should also be applied to the commodity country ticker symbols (EWA, EWC, EWW) until this $USD finishes rallying out of the oversold conditions.
For more information, catch the Market Watchers Live show with Tom Bowley and Greg Schnell. If you can't catch it live, catch the recording that will be available for the next two days. I will also be hosting the Market Watchers Live by myself on Friday, August 17th. That recording will be available all weekend. Click here to catch it live or the latest recording.
 Hey, don't forget to click follow on Twitter @Schnellinvestor and the big grey Follow button on the Vimeo channel. As soon as articles are posted, you'll be notified. We don't send anything else by clicking on these follow buttons.
 Good trading,
Greg Schnell, CMT, MFTA
