A wild ride for the indexes Thursday created all sorts of issues for technicians. Failed breakouts, double tops, trend lines snapping, and a myriad of other technical terms. It was a big day with relentless selling into the close.
Hard to find bright spots in a messy slide, but there were a few.
One of the areas of the market I am intrigued by is the precious metals industry group. This is an unloved, unpolished, area of the market. Silver had one piece of information this week, that moves it into the so unloved camp, there is no one on the other side. Commodity buyers like offside extremes as the trade sets up well from a risk/reward perspective. This week, the balance of contracts on the COT report for Silver went negative 1500 contracts. While that does not sound so alarming, even in the plummeting depths of the commodity crash of 2016, Silver kept a positive balance. So that makes it unloved. Extremes in commodities sentiment are usually a gift for patient investors.
On an institutional basis, no one is bullish. That is a double edge sword. If they are not bullish, they are not interested either.
In what has been an ugly period since the Fed meeting (the Fed also held a meeting the day before the big slide in Jan/Feb), the precious metals were under no selling pressure. They also have some nice chart shapes setting up.
One reason to take a look at precious metals right now is the ratio of GLD:$SPX. This ratio improves in two ways, Gold rises to outperform the $SPX or the $SPX falls while gold maintains its level. We currently have a bit of both.
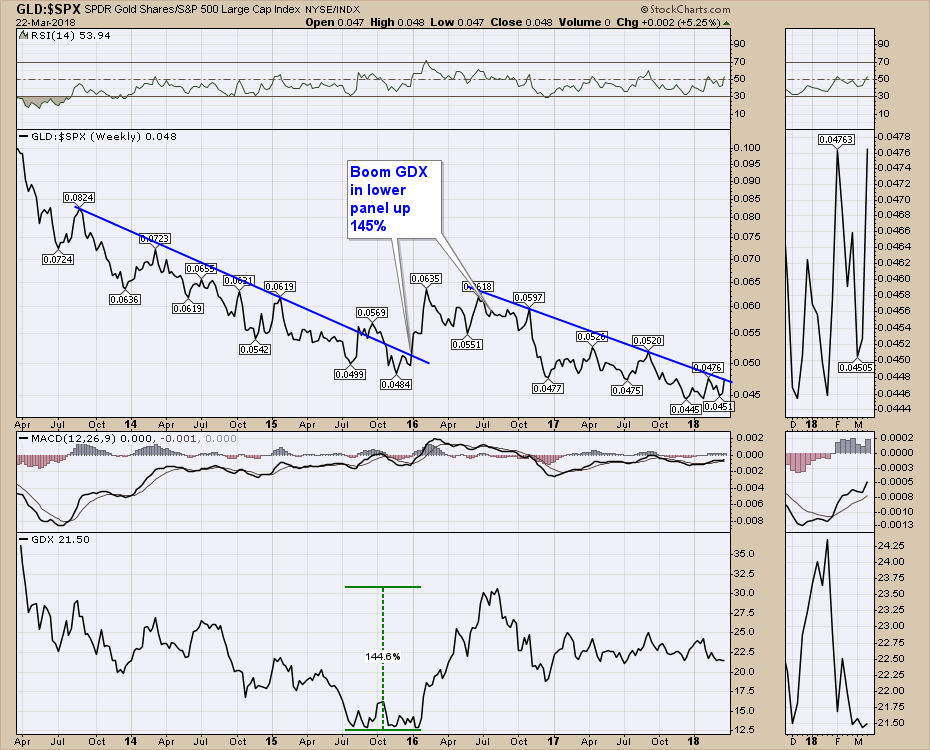
The big picture for $GOLD shows ascending lows and now we are approaching the 5-year ceiling. While that is definitely resistance, a move above would probably get the attention of every money manager globally. Headlines like "Gold At 4 Year Highs" would bring attention to most investors. So let's look at the setup.
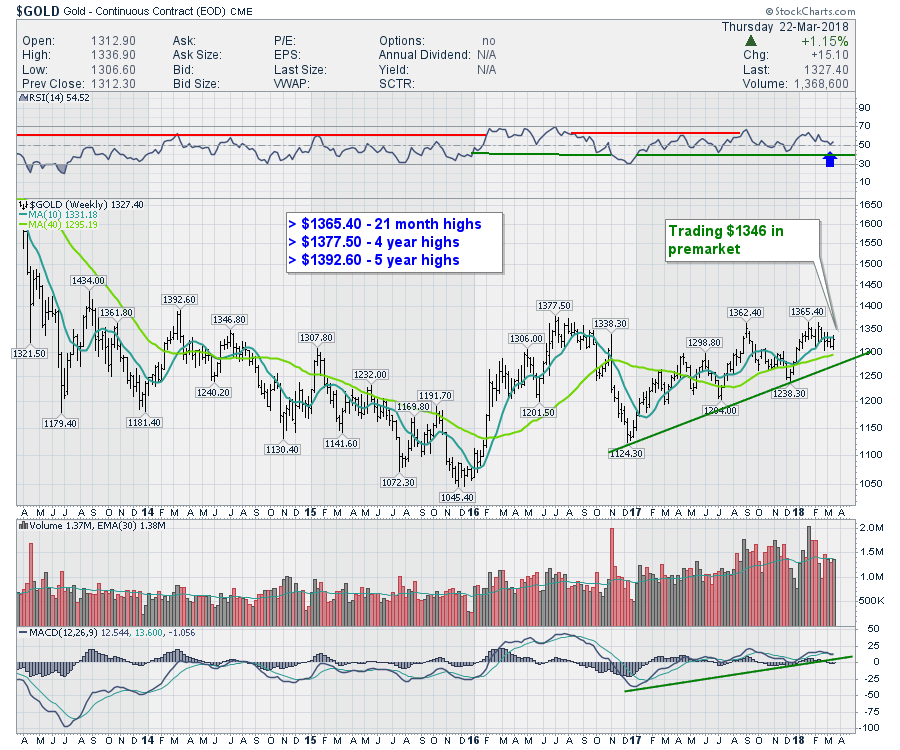 The volume has another day to go so this week should have a volume candle well above 1.5 M. With all the volume on the right edge of the chart, this looks like added pressure to the upside. The MACD is coiling nicely above zero. This is a very bullish setup from here.
Technical analysis helps you be aware of major turning points or inflections on a chart. This Gold chart looks a lot like that right now. I would say that if Gold cannot stay above the 10 WMA, we might need more time but I would not hold to watch. September 2016 is particularly interesting. When it failed at the 10 WMA over and over, down it went. That was after a steep vertical rise which we have not seen. This has been a slow and measured base, gently building a series of higher highs and higher lows.
The $SILVER chart is not as interesting, but it has a few technical patterns showing up for happy hour. First of all, the RSI has remained on a bull market signal since the summer of 2016. While it has been the most boring bull market, there is not a lot of selling pressure. Price is channeling sideways and is below the 10 WMA and the 40 WMA lines. The last five extremes on the chart show lower highs and higher lows creating a pennant.
The volume last week was the second lowest in the last 52 weeks. I usually see low volumes around the year end so I don't use those as reference points. The low volume in October 2017 had no effect this time. Ralph Vince, a fabulous technician who has written five books, examines volume. Low volumes and high volumes usually come into play around turning points on a chart in his work. Just being aware of that can help draw you to inflection points on the chart. Noted.
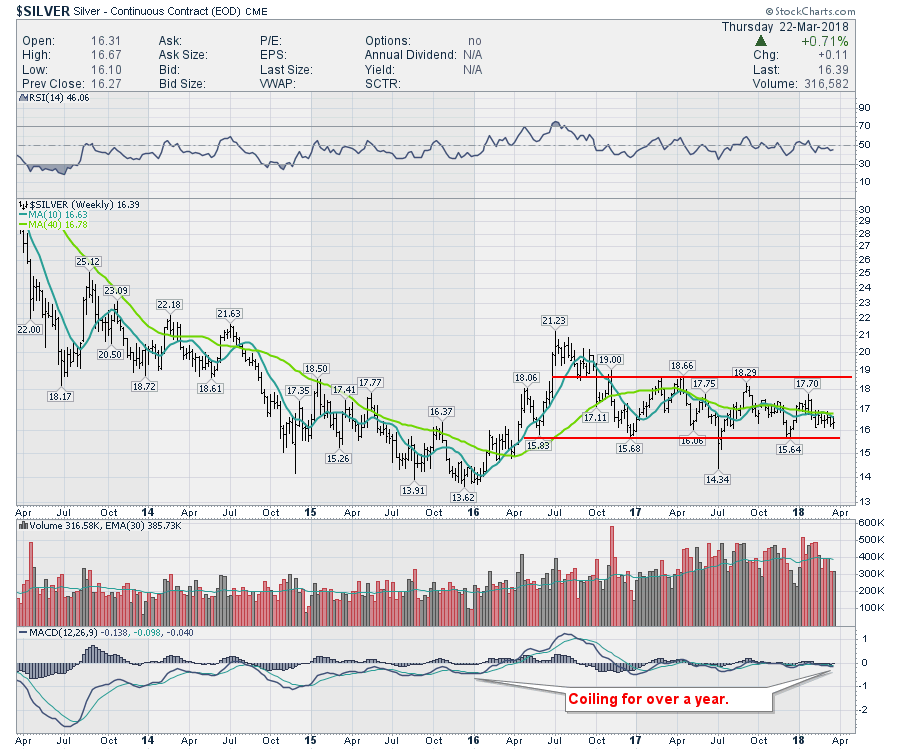 Lastly, the MACD is coiling again, for over a year. The calm before the storm.
I posted the video for this week's Commodities Countdown on the Vimeo channel. There is a big discussion about the Deutsche Bank chart as well as other financial institutions charts. That's a don't miss. I also covered some of the information in Thursday's Don't Ignore This Chart article - Maybe Its Not About Steel Tariffs.
Here is a link to the Commodities Countdown video.
Of course you've heard I have a book published. Well, our book store at StockCharts is heaving with another massive shipment. If you wanted a handbook of tips and tricks for getting your StockCharts account running smoother, this would be it. If you are new to charting, this is a why-to-chart book and how to set up those charts. Perhaps your best friend needs one of these books as a gift to understand why you are so interested in charting!
 There are some nice reviews on Amazon. Go hunt them down there or click on the StockCharts Book Store to buy your copy today.
Lastly, I did a presentation to the Minneapolis CMT Association this week. That is posted on the vimeo channel as well, but here is a link to a pretty interesting presentation.
Good trading,
Greg Schnell, CMT, MFTA
