Last week the Russell 2000 gave off some very important clues that the markets were ready to break. While sometimes they rally from these levels, the actual setup can make technicians more aware of the keen balance the market is currently in. While no one needs to be too quick to call a market top or a bear market, a technician can at least be aware when the setup is there for more downside.
Some of those conditions could be Net New Highs which I use a lot. Arthur Hill's work uses Advance-Decline lines a lot. I also use Bullish Percent Indexes and the percent of stocks above the 200 Daily moving average. We all have tools in our tool box.
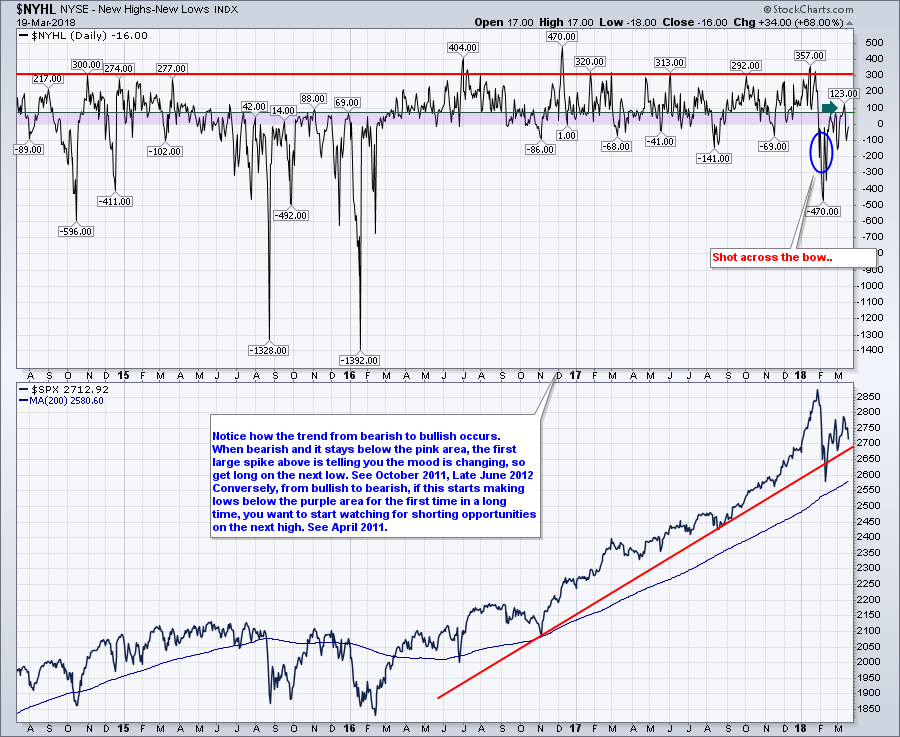
Here is the one I like for Net New Highs. In early February, we got a big pullback in Net New Highs. It was bigger than anything we had seen in two years. To me, that sends a warning shot. Much like the warning shot in October 2014, it was the first time there was a significant low reading. But it is the following data that helps us understand where this market wants to go next. In 2014, the market resumed its climb to lofty new highs. It remained up there for months and continued to record an abundance of new highs above the purple area. Notice how the $NYHL changed as we reached the market top in May 2015. We were not creating a lot of new highs. We struggled to get above 100 for months. Then the market went lower and we had a surge in negative readings.
On this recent bounce we were not able to rekindle the plethora of new highs even though the NASDAQ was at a new high and the Russell 2000 was trying to make a new high. The $SPX was a little lower. With all the rallying we were unable to make a lot more new highs than lows. Looking left, which does this look like more? The bull market after February 2016 or the period going into the 2015 market weakness?
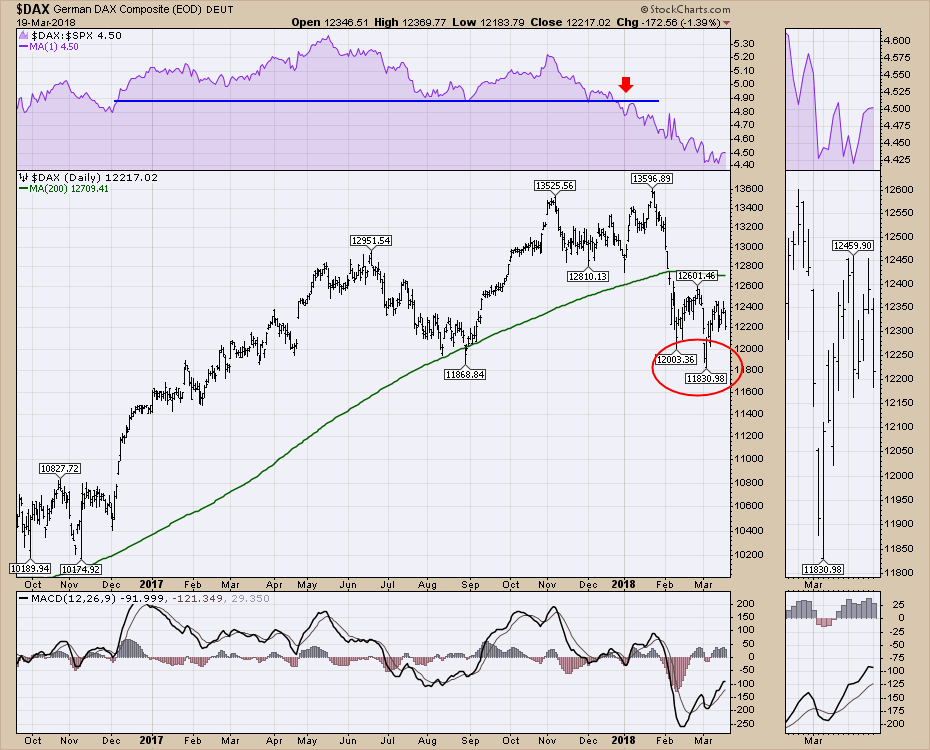
Some of the other concerns are the global markets are starting to weaken. Germany recently broke to new 52 week lows! While I would not expect the US market to be the first to weaken, if the global charts are weakening, its hard to imagine that the US market can keep running all alone. France has a negative reading on the PPO, and London is close to 52 week lows.
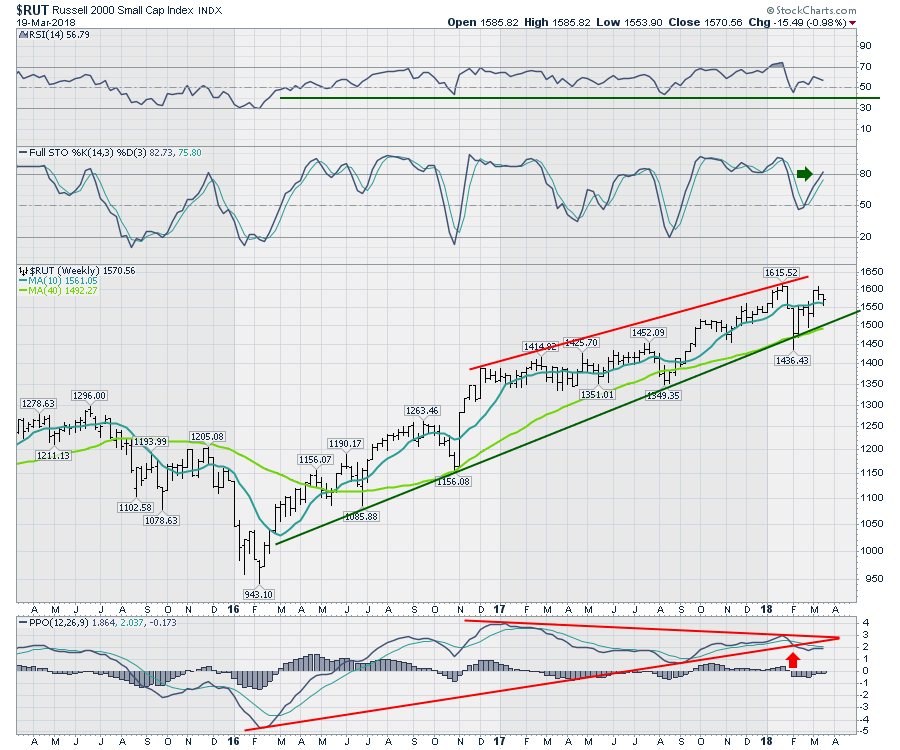
 In the video link farther down, I discuss the problems with the Russell 2000 chart. My weekly setup for the $RUT concerns me immensely. Starting at the top, the lower high on the RSI on this recent high is not as concerning, but it is something to keep in mind. Secondly, the full stochastics are reaccelerating above the 80 % level so that is bullish. Where I get concerned is the information on the PPO. The most recent high in price was a test of the previous high. The PPO is much lower. Comparing recent highs on the PPO to the early 2017 highs, the momentum is also weaker. Smaller factor but still concerning. When I see the two year trend in momentum (Red line) break, I really want to be aware for a potential change in trend in the chart price.
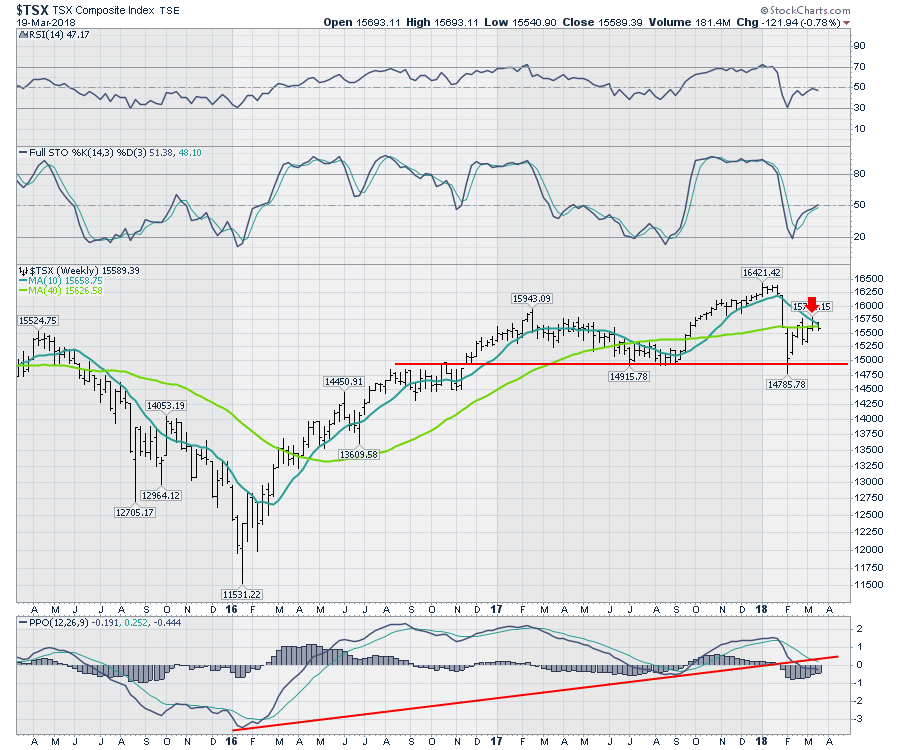
 This also coordinates with the weakness in the Canadian Market. The Canadian market is having trouble bouncing back above the 40 week moving average. Just being aware of the potential for more downside is a big help for technical investors.
 All this to say, the equity market indexes are very fragile at the current levels.
The StockCharts for Dummies book is now available wherever books are sold!
I will be speaking to the CMT Association in Minneapolis March 20th, 2018 by webinar with some very exciting charts (heck- they even keep me up after midnight!). If you would like to join in person at 4 PM CDT, please register for the CMT Association meeting. CMT Association Network Events.
I will also be attending the Calgary CSTA meeting March 20th at 5:30 MDT. CSTA members can register here for in-person or here for online access. I'd love to see you there!
In the index video for the week, you'll see the indexes have some early weakness showing up. The video was recorded before Monday's breakdown. The video below invests a quick 30 minutes describing the current tenuous situation for equities. It is a little more tenuous with Mondays lows.
Good trading,
Greg Schnell, CMT, MFTA.
