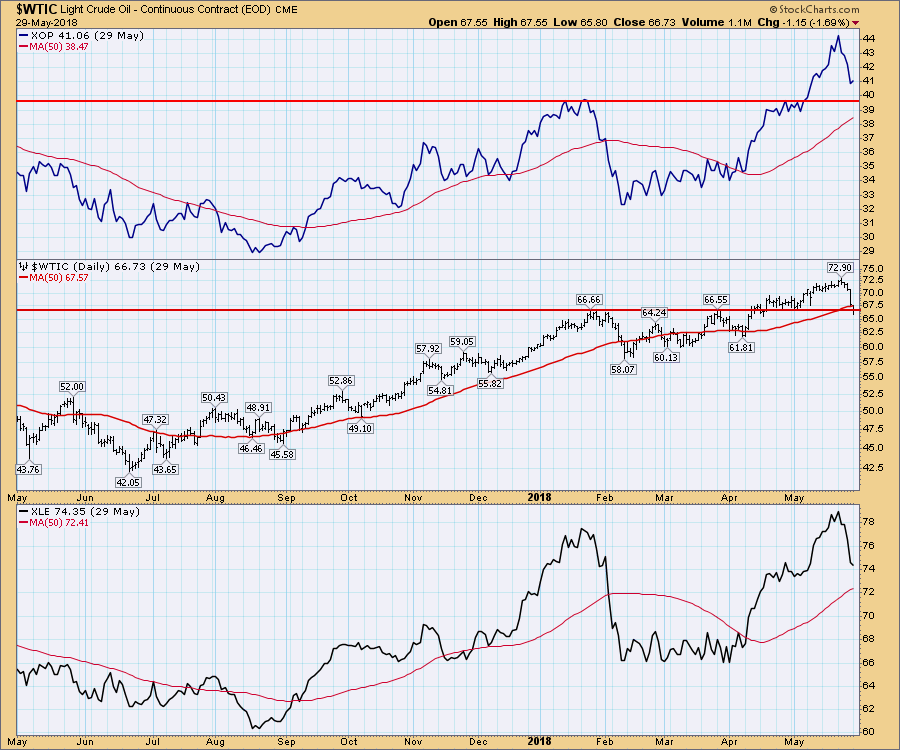
The wobble in the market on Tuesday was quite significant. This appeared to start last week with the reversal in oil and bonds. Crude is hovering around the 50 day moving average. You can see on the chart below, the 50 MA is pretty important. Watch for this low to hold. On the video I talked about the $66.66 level from January to see if support / resistance would hold. Take note that the related stock ETF's are still well above the 50 MA.
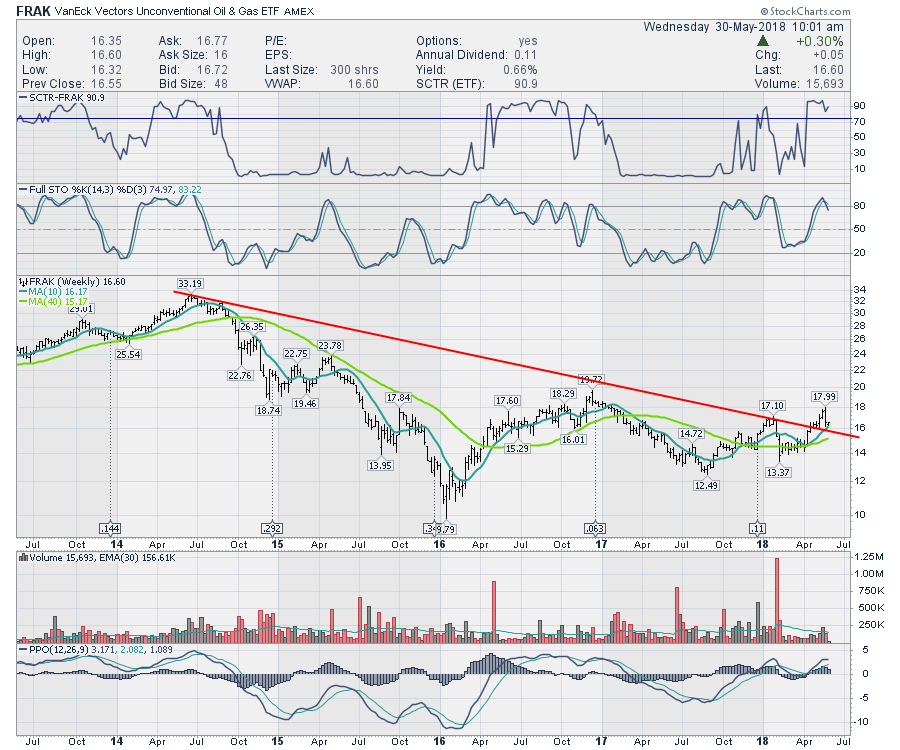
FRAK, the unconventional oil ETF, broke through a big downtrend last week but rolled over last week. Now it is trying to hold the backtest. This $17-$18 level looks important.
I spent quite a bit of time working through the breadth indicators on the video. Unfortunately, the typical things I like to look at are teetering on the edge. As an example, we are still struggling to get big thrusts on the $NYHL chart.
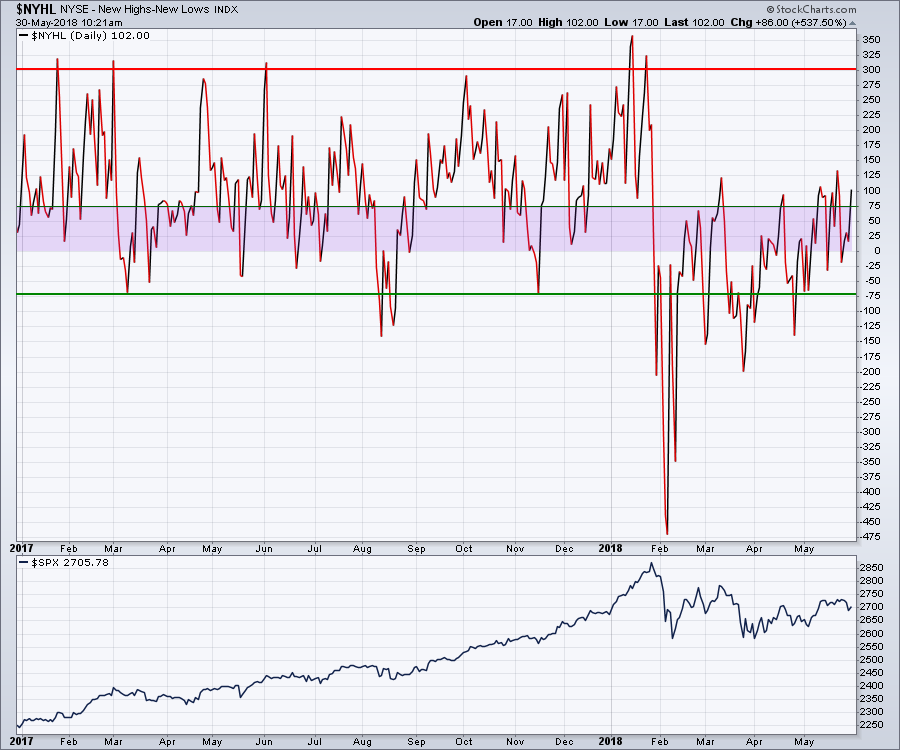 We can see that the lack of big thrusts shows the market is stuck and unable to break out. One positive is that we continue to have rising lows. The last three weeks, we are hovering closer to the breakout levels. All that to say, we need to get the $NYHL to push higher to get the overall market starting to make higher highs. So the chart is not bearish, it's just not bullish either.
I like to use the Bullish Percent Index ($BPSPX) in concert with the % of stocks above the 200 MA ($SPXA200R - lower panel). The 2010 price action looks similar on the $BPSPX panel. Eventually we break out to the upside. The difference there was the $SPXA200R was down around 50%. There are 4 red arrows on the chart and the chart would suggest we can add another one here. So my point on this chart is:
- The $BPSPX has been unable to get back in bull market mode above 65%.
- The $SPXA200R is hovering right around 60, which is a susceptible place for the market to fall lower.
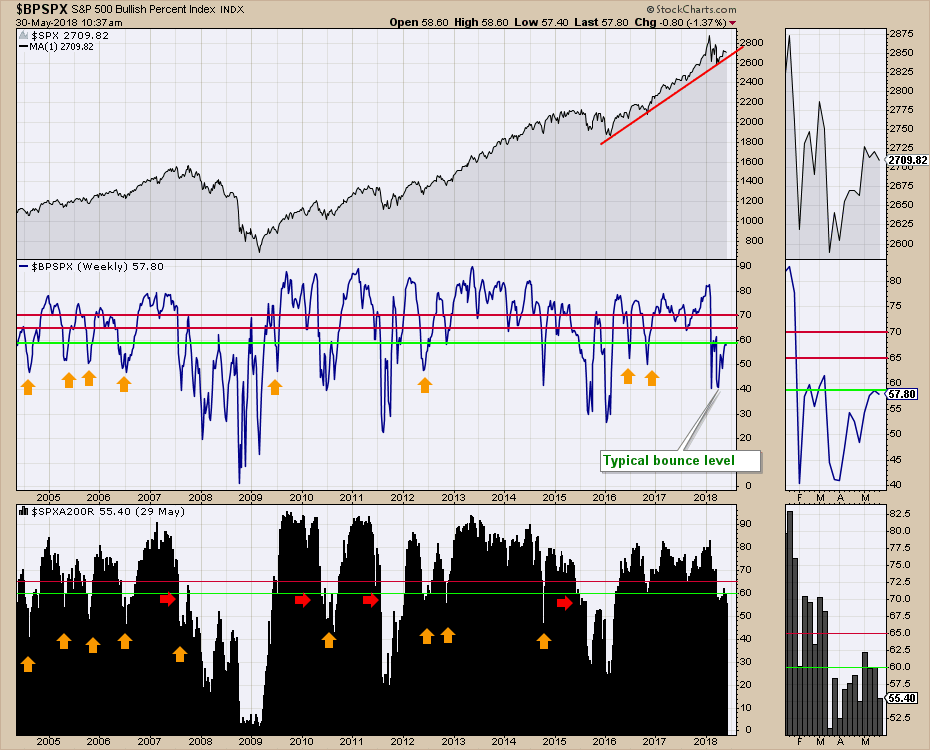
There is nothing suggesting that it can't rebound from here and go higher, but this weakness is starting to linger long enough that a longer, larger pullback would match up with history. Bottom line, the rally better start soon.
I spent a long time on the bond move and yesterday this move continued. This is a weekly chart, so we need to wait for the month end (Thursday) and Friday for the end of week chart information. Let's discuss the scenario.
First of all, the brown dotted line marks the 3.0 % yield level for the 10 Year. Looking in the zoom panel, the 30 level was tested then the yield broke higher. With one close above the level, it is important to get follow through and a second close. Well, that didn't happen and the chart failed to hold. The PPO had a negative divergence between the January 2017 top and the February 2018 top. Now we have a second negative divergence between the February 2018 and the May 2018 top. This chart looks very bearish to me.
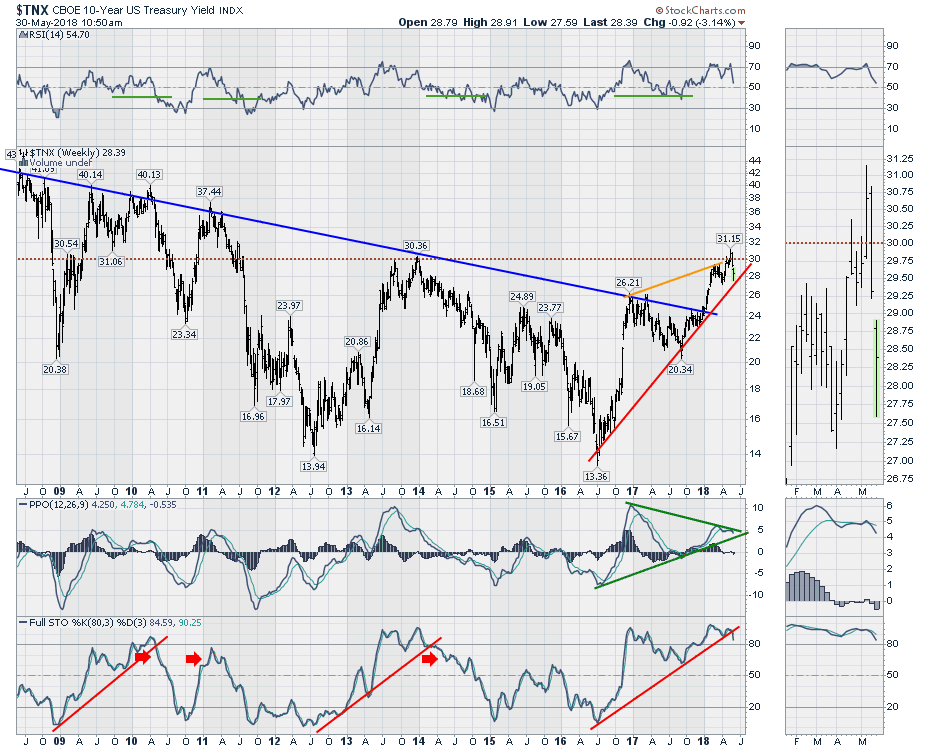 Looking at the Full Stochastics, we have seen this run up before. Once again this looks to be confirming the sell signal. This should be bullish for Utilities, REIT's, MLP's etc. Notice the full stochastic setting is 80,3. I'll have more on this on this week's Final Bar Thursday at 5 PM.
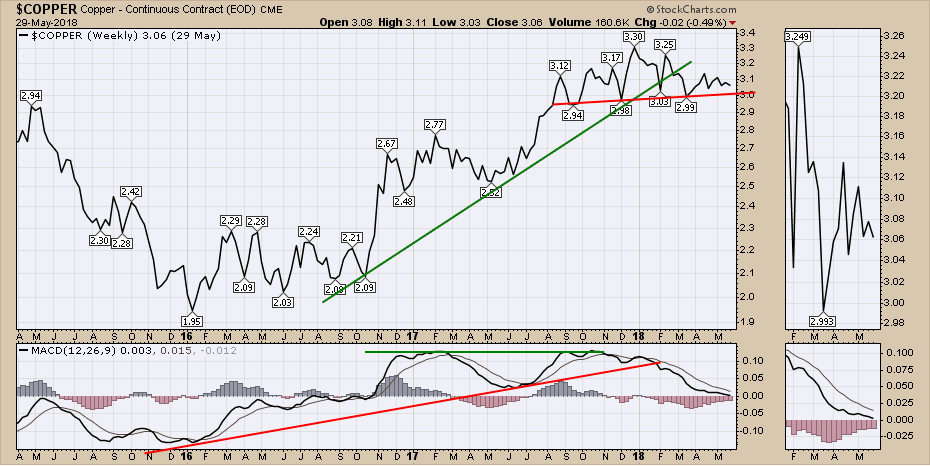
The industrial metals charts are looking weaker, starting with Copper. While the charts are not broken, they are definitely at risk of breaking down. The MACD is at zero, so a turn up here would be very bullish. Conversely, a negative MACD on a weekly chart is a big problem.
 There is a lot more information in the video.
I host a new TV show on StockCharts.com called The Final Bar. It airs Thursdays at 5 PM ET and is repeated throughout the week on StockCharts TV. You can also catch it on my Vimeo channel or on the StockCharts.com YouTube Channel.
Good trading,
Greg Schnell, CMT, MFTA
Senior Technical Analyst, StockCharts.com
Book: Stock Charts for Dummies
Twitter: Follow @Schnellinvestor
