This week saw most of the commodities continue lower. Wheat actually moved above the 10 Week moving average. All of the rest of the commodities are below. It is not very often everything is this beaten down.
The $SPX was flat for the week. The US dollar dropped hard on Friday back into the middle of the two month trading range. As well the bond prices fell away from resistance pushing the long end of the yield curve higher. Gold has some nice buying wicks for the last three days in one of the most unloved areas of the market. It is already up $20 off the lows of Wednesday.
Let's start with Gold daily. First of all, we are looking for some place to expect support for Gold to kick in. Looking at the chart below, the up-sloping trend line on GLD did not hold. There is a great reason to expect $115 to hold as it has been a major support resistance level on the chart for a while.
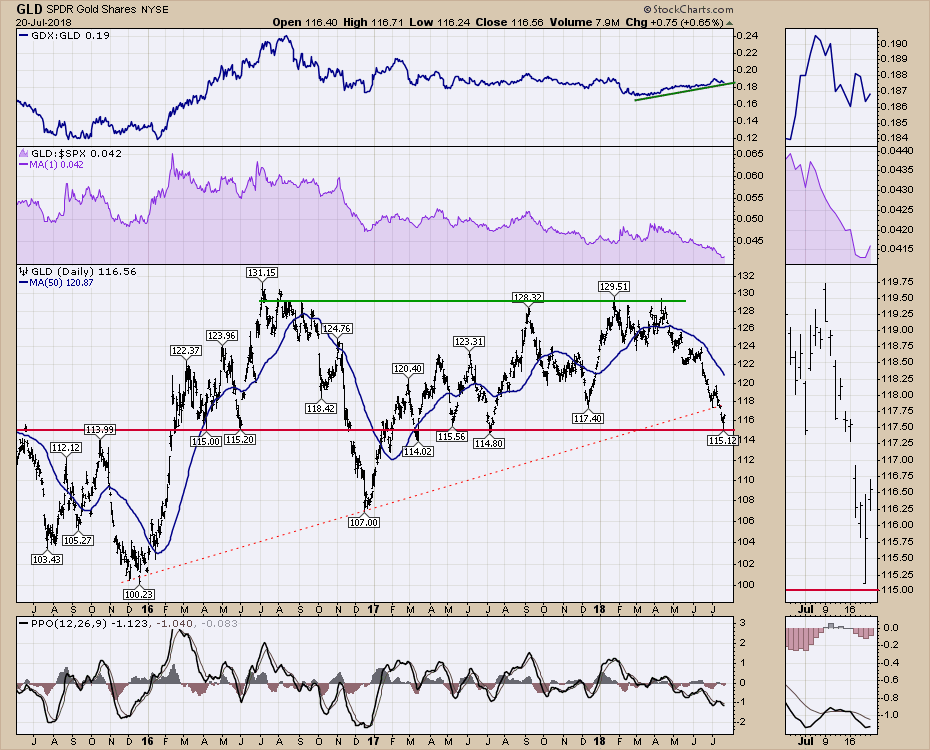
This bounce level looks like it is being actively bought in the zoom box on the right. Thursday's price bar gapped lower, traded all the way above the previous day creating an outside bar, but it closed in the middle of the range. Friday gapped up, and closed above the previous day's trading range. This is the sort of bullish price action we like to see. The other thing to note was GLD made a new 52-week low this week. Sometimes that is a great place to look as annual pivot points get tested. The big pull back on the US Dollar didn't hurt either. That was supportive.
The nice part about an entry here is if wrong, the stop is nice and close. As we say in the industry, it gives you something to shoot against. If $115 doesn't hold as support, let it go. So while the price of Gold has not formally reversed as it is barely making new 3-day highs, it has all the markings of a great place to look.
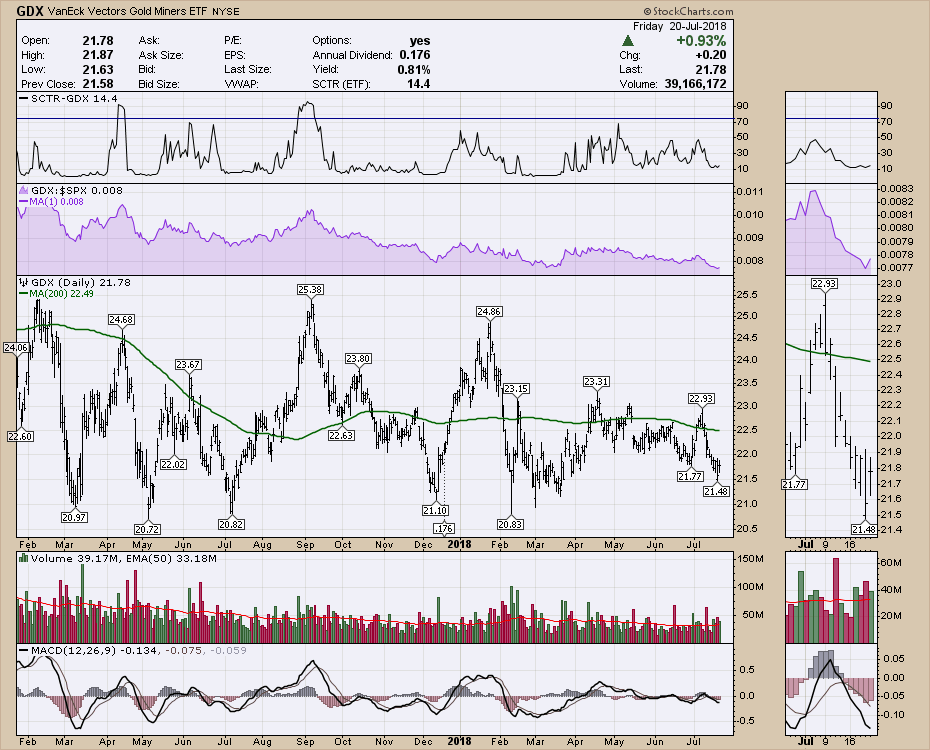
GDX, the ETF tracking gold miners, also tried to rally. It is still in a sideways trading range. A stop just below the last few lows would also be something to shoot against.
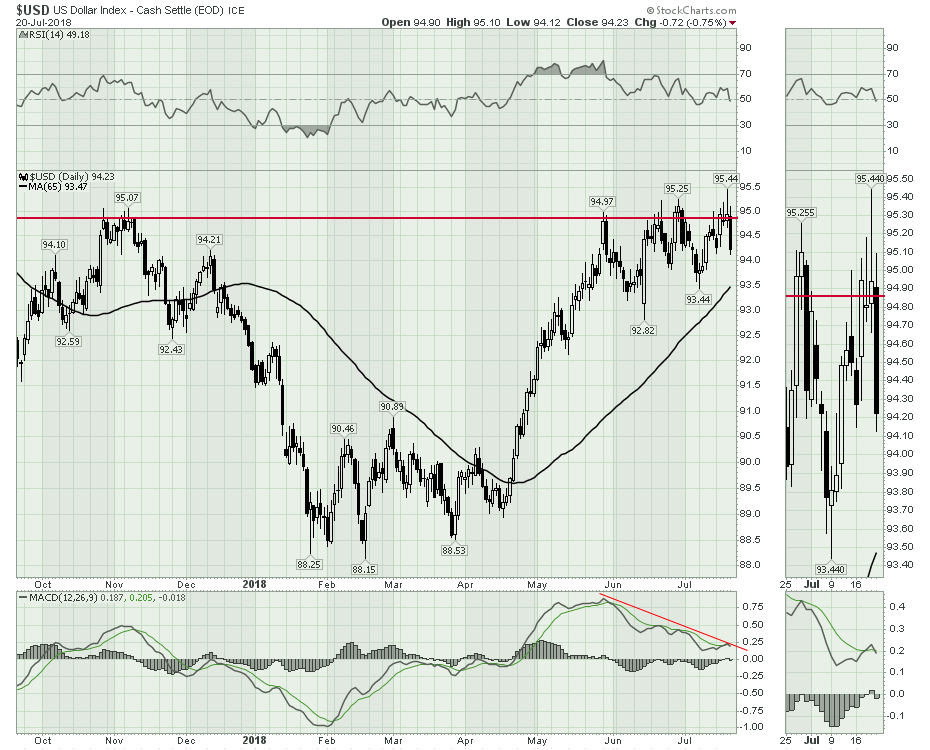
 The daily chart of the US Dollar created some wild swings on Friday. After surging to a new recent high on Thursday, the US Dollar reversed and slammed to close lower than the lows of all week. More importantly, the momentum continues to create a big divergence by moving lower while the dollar was making higher highs. This is one of the wild swings I was referring to in the title.
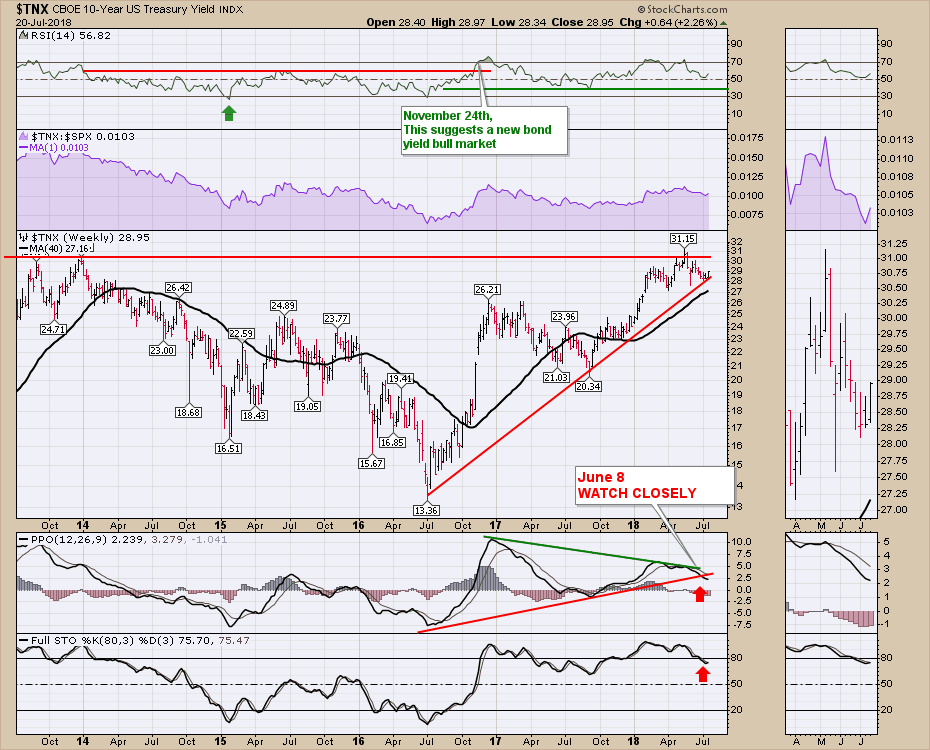
 The 10-year bond yield also reversed and closed near 4-week highs which is shown in the zoom box below. After a false breakout in May it travelled all the way down to test the lower trend line. So the range gets narrower and the bull-bear debate gets more fuel. Currently we are back in the middle of the range. Destination unknown. But mark another chart with a trend reversal for now.
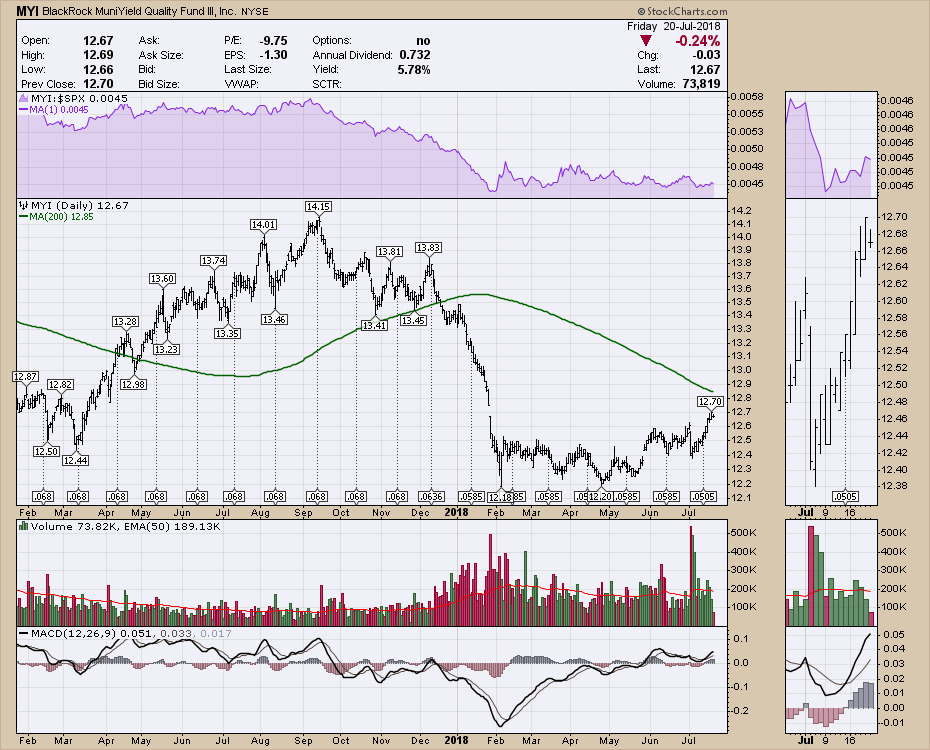
 I will say that I like to track the Municipal bond funds for help in assessing the direction of the 10-year. It closed higher in price this week which is the opposite to what 10-year bonds (prices) did.
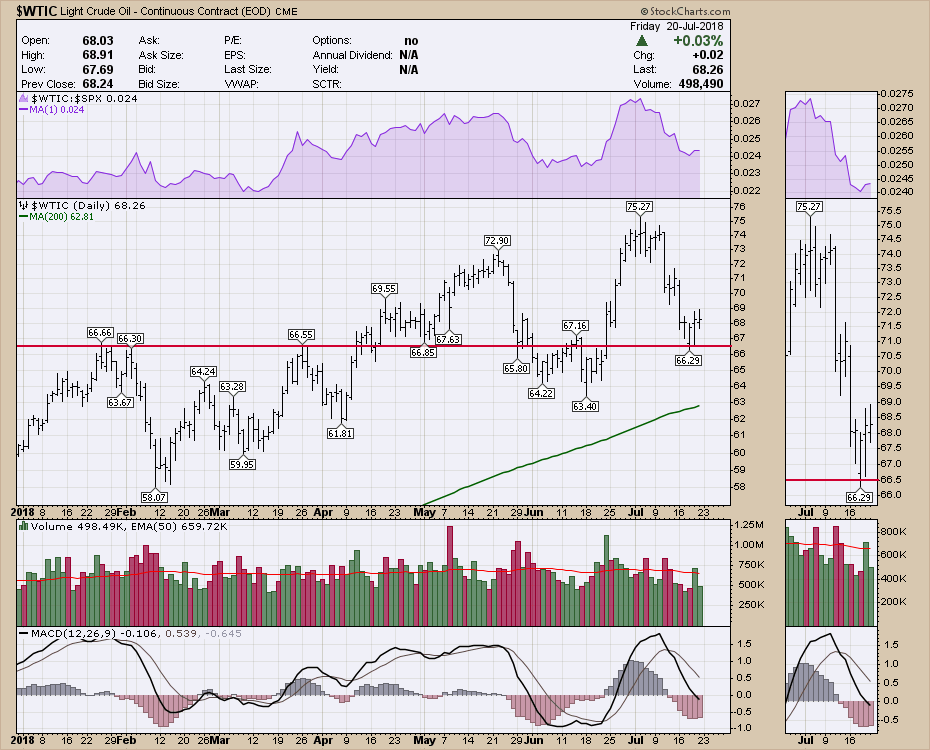
 Oil is trying to find support at $66.50. Much like gold, it is a little early to say the rally is under way but it is a good place to expect a reversal.
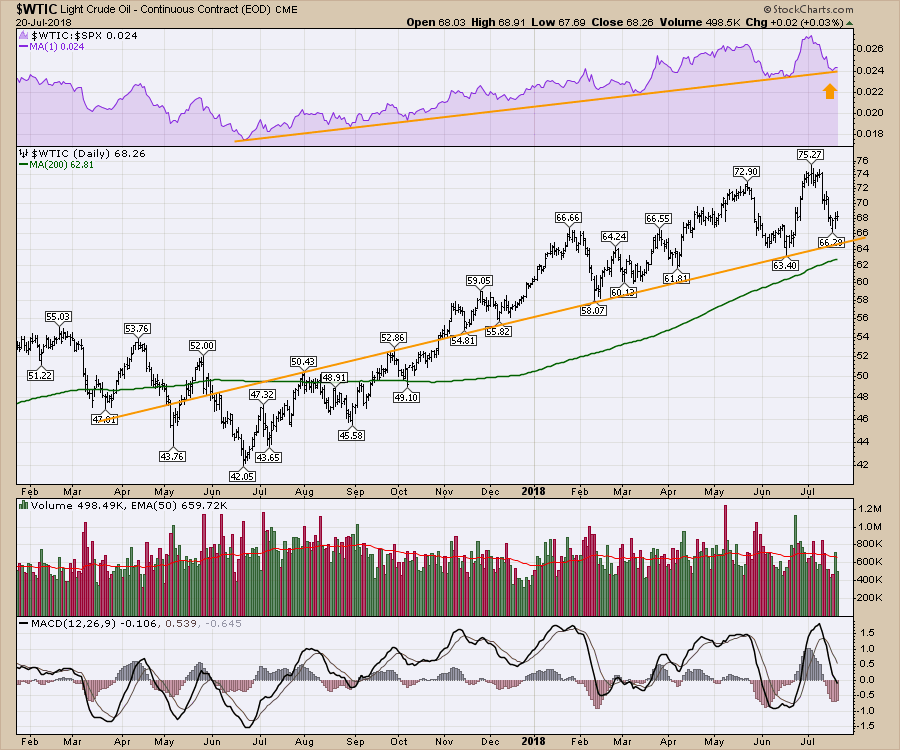
 As long as this relative strength line continues to hold up, oil should attract more investors. Currently oil, the Bullish percent Index and XLE are below the 50 day moving average. XOP, the Exploration and production ETF, is slightly above the 50 DMA. When these are all above its a good backdrop to be involved. Currently, it is a little more bearish. It wouldn't take much for all of the charts to push back above, so that is a good thing to be aware of.
I must admit, I continue to be uncomfortable with the indexes and the current momentum. While the $SPX had a doji candle this week (A candle that tests higher prices and lower prices and closes where it opened), it is a poor week to stall momentum with earnings season in full swing. While that in itself is no big deal, it is the combination of charts that have me concerned.
- Failure of the $SPX to get a short covering rally to kick in as it moved above 2800.
- The 11 EMA of the $NYSE advance/decline line is near zero.
- The NYSE Net New Highs data continues to be lacking in getting a kick off rally going.
- The Bullish percent index chart has very similar data in the run-up to the current levels as we saw in the market highs at 2007, 2011, 2015.
- The percentage of stocks above the 200 DMA is also mapping 2007, 2011 and 2015 similarly.
- The monthly $SPX has a sell signal on the PPO chart. The weekly $SPX PPO is still holding a buy signal.
- While the $NDX continues to make new highs, the summation index is starting to lose momentum higher.
The $SPX weekly PPO is much lower in momentum and a rough week would kick in a sell signal. So I am watching the markets to see if they can get a momentum thrust and they just keep disappointing. Trying to break through 2800 on the $SPX was a big deal. It got through but has had no follow through. The Russell 2000, which was doing really well, looks the weakest on the shorter term charts. It made its recent daily closing high back on June 20th. It tested that high 2 weeks ago and marked a double top so far. It did make a higher intraday high by a 1/2 point but not a higher closing high. Considering it was leading the pack, now it appears to be stalling with the closing high a month ago.
All that to say, I am cautious here.
Below is the Commodities Countdown video that walks through the concerns in the index set up right now.
The Final Bar recording for Thursday July 19th contains information on the fresh Thursday breakout in the $USD. I cover off bonds as well. All of these markets are at very critical technical locations. If the USD is going to soar and create a bunch of trend changes on the other charts, you'll want to see the setups in advance. That is what the video covers off.
This week's Canadian Technician video discusses a lot of the sectors and specifically reviews the technology sector stocks.
If you are missing intermarket signals in the market, follow me on Twitter and check out my Vimeo Channel often. Bookmark it for easy access!
Good trading,
Greg Schnell, CMT, MFTA
Senior Technical Analyst, StockCharts.com
Author, Stock Charts for Dummies
Want to read more from Greg? Be sure to follow his two StockCharts blogs:
Commodities Countdown and The Canadian Technician
