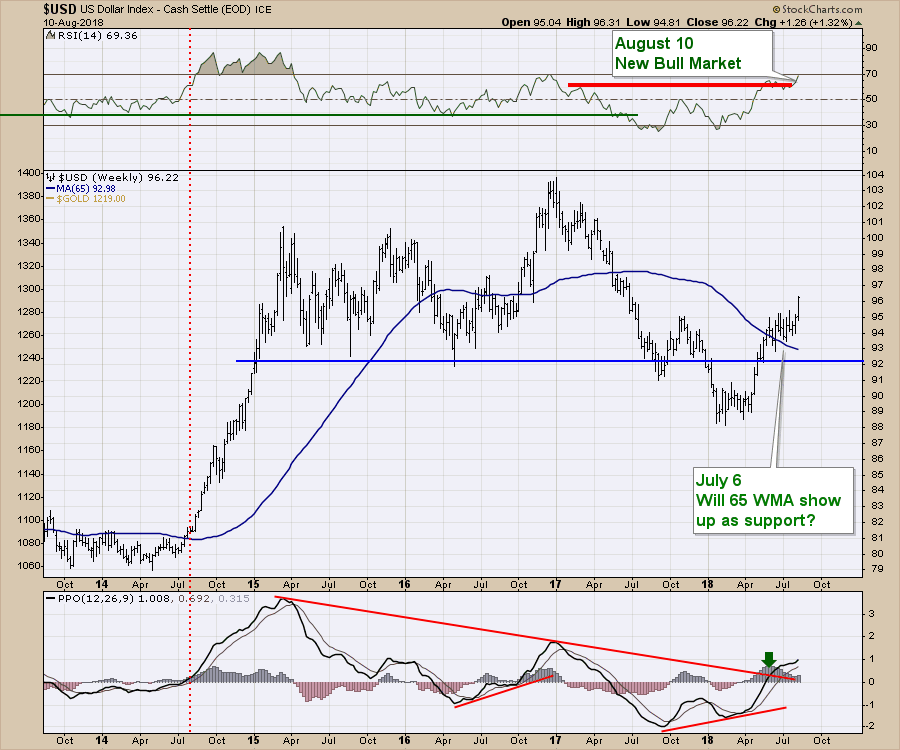
It seems like most weeks I start this article with a discussion of the dollar. This week will be no exception. The Dollar subtly broke above resistance. Actually, no, that is not what happened. The dollar popped like a champagne cork above resistance and there was nothing subtle about the move. Currency charts all over the world snapped through meaningful levels. A few currencies stayed in their ranges but most lost support. The biggest thing on the chart is the weekly RSI kicking out a bull market signal. The PPO broke out of the down-sloping trend in momentum a while ago, but the RSI doesn't reach 70 without a lot of momentum. This week it did. I will trade based on a bullish US Dollar until the RSI drops back to 30. After the brief break in the 6-year bull market trend, it has resumed.
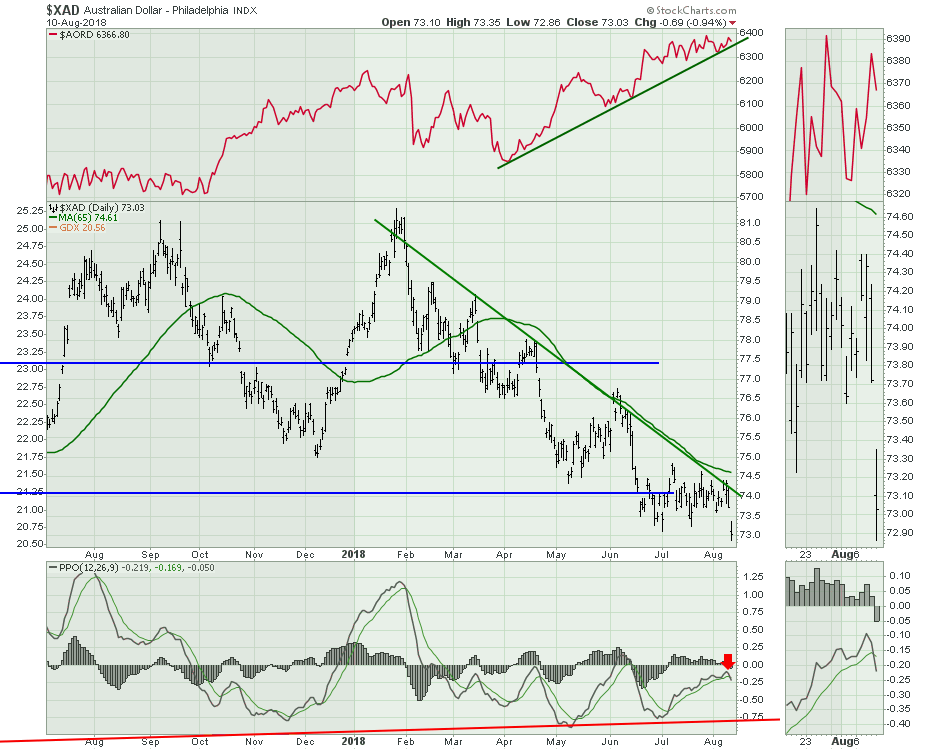
The Euro plummeted. Not like everyday plummeting. It gapped through support and kept on falling. While some of this was on the back of the Turkish Lira fizzling on Friday, the Euro chart did not look strong anyway. This is a daily chart, where you can see the big move was Friday and the Euro lost support of a one-year topping structure. The PPO had let go a few days ago and rolled over while below zero. That's a signal of extreme weakness, so I expect more from this move. Looking left on this chart, this 115 level was also a major resistance level in 2016/2017.
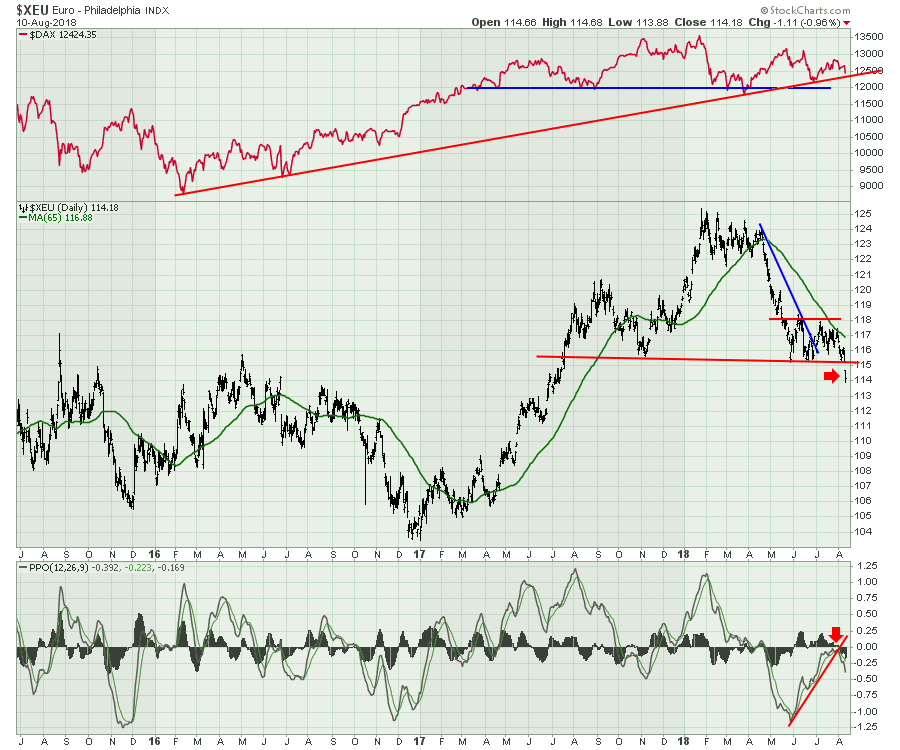 The Canadian Dollar suffered. The Canadian stock market shown in the top panel made a new all time high in July, but has had trouble holding the gains. Currently it is back below the 16420 level or the previous high. The real news is the PPO on the Canadian Dollar chart looks exactly like the the more advanced Euro chart. I expect more of the same as the price panel failed at resistance and the PPO failed right at the PPO momentum highs line. The one positive is that the Canadian Dollar PPO was slightly above zero when it rolled over, but that is hardly a bullish looking momentum indicator.
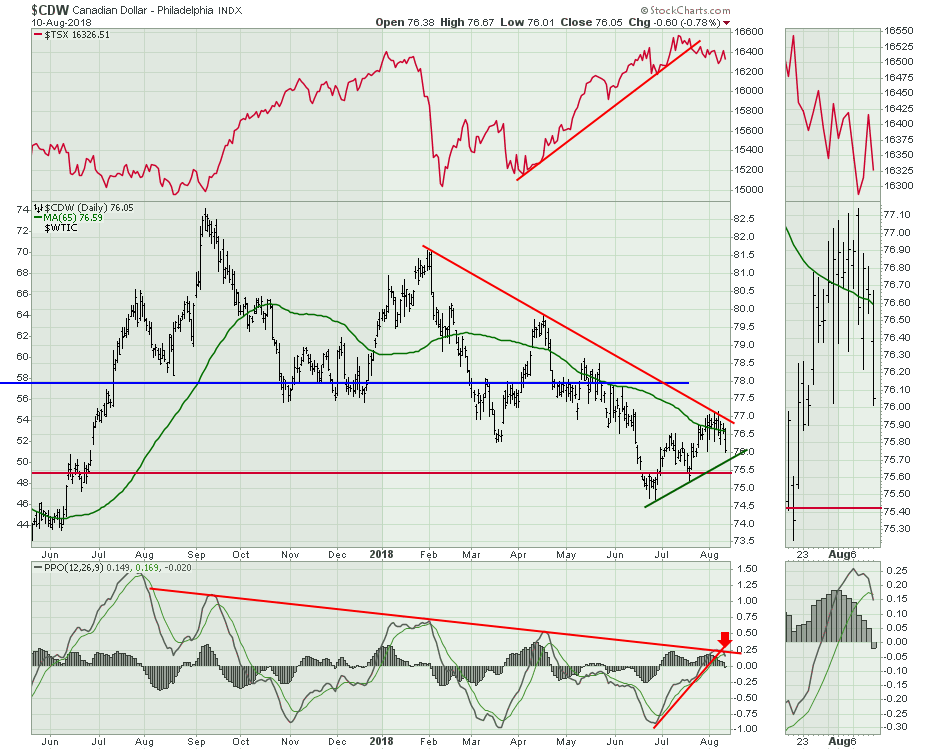 The Aussie Dollar lost support. Living in the lower right corner of the chart for a while, Friday's action cemented more downward pressure. The PPO rolled over to cross the signal line and looks to be failing under the zero line again. 74 was a meaningful level, but the currency couldn't hold there and splashed lower. The uptrend in the $AORD in the top panel will be tested again this week. If Canada provides a clue, I would expect the trend line to break. This is not really a surprise to see the commodity countries roll over with a rising $USD.
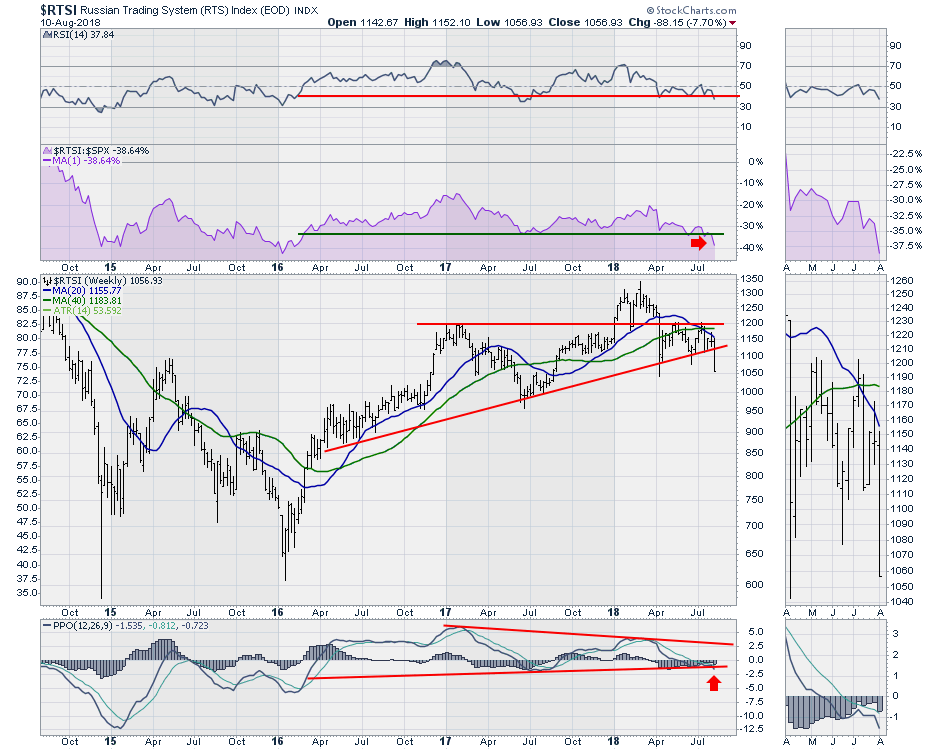
Speaking of commodity countries, Russia got smoked this week. The other three price bars that went below the red line on the price panel were intra-week lows. This was a close on the low. Ouch! The RSI breaking below 40 is bearish. The relative strength line breaking below 2-year support is outright bad. Lastly, the PPO momentum is breaking a trend line and rolling over while under zero on a weekly chart. That doesn't create a bullish environment.
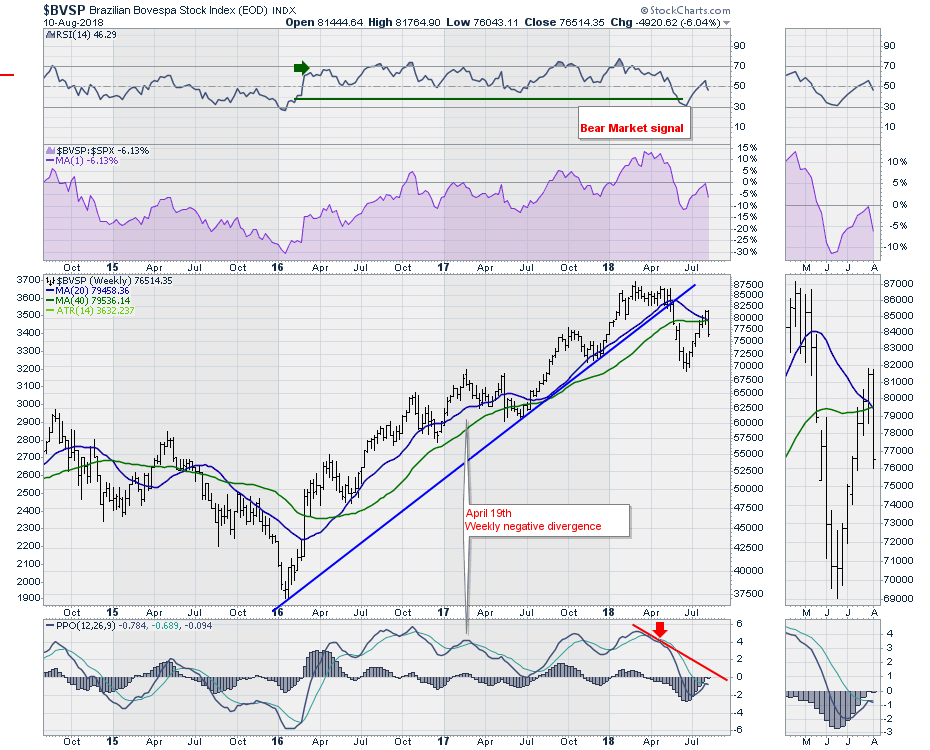
 Moving into Brazil, the ugly commodity related charts just keep showing up. This is textbook topping action. The market spent three months trying to make higher highs. It pulled back below the blue trend line. On the RSI it recorded a bear market signal like Canada did. It rallies up for one more final high and fails around the 40 week moving average in green. On this recent high, the PPO is rolling over below zero. OUCH!
 There is a lot more coverage of the current market environment on the video. Needless, to say commodities look rough here. On the video I cover off one potential bright spot, which is Natural Gas. Have a good week and I hope you enjoyed ChartCon 2018!
Below is the Commodities Countdown video that walks through the commodities set up right now.
The Final Bar show from Thursday is posted here for your convenience.
Below is the recording of the most recent Canadian Technician Video. This video shows some great examples of how breadth breaks down before the markets weaken.
Don't forget to register for Chartcon 2018. It starts tomorrow morning, bright and early!
If you are missing intermarket signals in the market, follow me on Twitter and check out my Vimeo Channel often. Bookmark it for easy access!
Good trading,
Greg Schnell, CMT, MFTA
Senior Technical Analyst, StockCharts.com
Author, Stock Charts for Dummies
Want to read more from Greg? Be sure to follow his two StockCharts blogs:
Commodities Countdown and The Canadian Technician

