 This will not be about punctuation. Have you ever wondered why most of the media focuses on the Dow Jones Industrial Index? Some would say it isn’t a good measure of the overall market, including me? Yet, it does a reasonable job of representing the overall market. Same goes for the S&P 500 Index. Let me explain.
I used a great deal of stock market data in my books, primarily the daily series for the Dow Jones Industrial Average and the S&P 500. Reliable data is very important for proper analysis. I have seen references to stock market data back to the early 1800s or even earlier, but it was spliced together from numerous sources, usually by academics who I think just don’t have the same appreciation for accuracy as I do. The two series I used most often have been in existence with original source since the start date of the data I used. Below is some information about that data used in my books.
Dow Industrials – my series began February 17, 1885, but records show that Charles Henry Dow began the series on July 3, 1884. While Charles Dow began publishing his series in 1897, he maintained the data from 1885. Following the introduction of the 12-stock industrial average in the spring of 1896, Dow, in the autumn of that year, dropped the last non-railroad stocks in his original index, making it the 20-stock railroad average. Initially the data was known only as the Dow Jones Average. In 1916, the industrial average expanded to 20 stocks; the number was raised again, in 1928, to 30, where it remains today.
The Dow Industrials is a price weighted index. To calculate the Industrials, the sum of the prices of all 30 stocks is divided by a divisor, the Dow Divisor. The divisor is adjusted in case of stock splits, spinoffs or similar structural changes, to ensure that such events do not in themselves alter the numerical value of the Industrials. The current value of the Dow Divisor is 0.14602128057775 as of March 11, 2016. This means that every $1 change in price in a particular stock within the average, equates to a 6.85 (or 1 ÷ 0.14602128057775) point movement. A big criticism of using price-weighted, which gives higher-priced stocks more influence over the average than their lower-priced counterparts, but takes no account of the relative industry size or market capitalization of the components.
S&P 500 – my series began December 30, 1927. From the beginning until March 3, 1957 it was the S&P 90. There is, however, older data produced by the Cowles Commission back to 1871. The S&P 500 is a cap-weighted index. Cap-weighting uses a stock’s market price and the number of outstanding shares to determine the percentage weighting of the stock’s inclusion in the index. The larger the components, the larger that stock will be weighted (allocated assets) in the portfolio. Personally, a big negative for me with the S&P 500 is that its components are chosen by a committee and they have a tendency to overweight it when a sector is doing well. As an example, in the late 1990s they over weighted the index with technology just prior to the bear market that began in 2000.
There is another type of index weighting that has become popular in the last couple of decades. Equal weighting distributes the same investment amount into each company stock in the same pro-rata amount. All companies, regardless of their capital size, will thus be represented equally in the index. Chart A shows the performance of the Dow Industrials, S&P 500, and S&P 500 Equal Weight since the beginning of the bull market. It is obvious that the equal weight (red) performed better. I realize comparing the Industrials with the S&P isn’t too valid but I could not find a price-based series for the S&P. My old friend Carl Swenlin (old being an adjective to friend) summed it up nicely – individual’s portfolios are not cap-weighted.
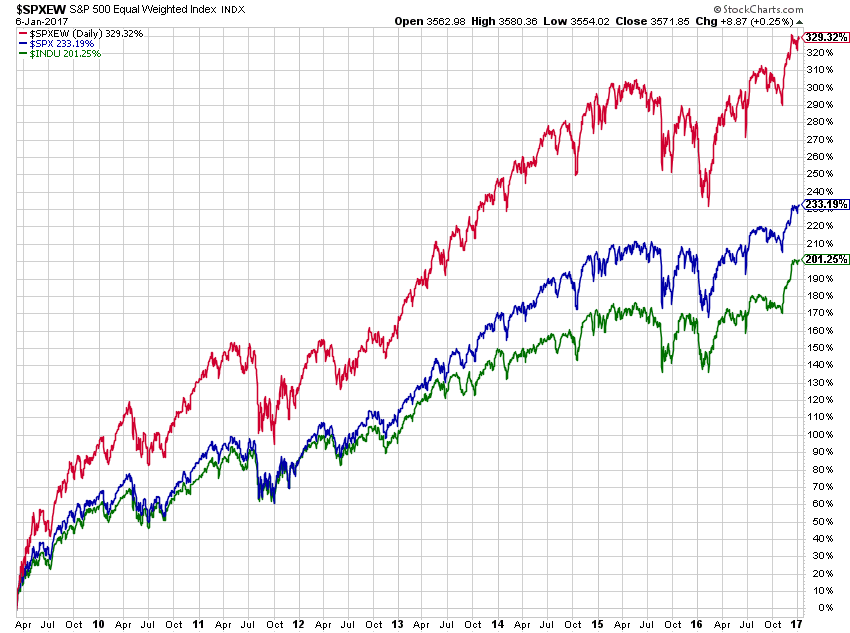 Chart A
So, what is the message with these ramblings on capitalization. The movement of the market is best measured with something other than cap-weighted or price-weighted indices. Most indices are cap-weighted. I read some years ago that that the top 10 stocks in the Nasdaq 100 index based upon capitalization accounted for 46% of the movement of the index. And the media’s focus on the Dow Industrials along with Wall Street’s focus on the S&P 500 as a benchmark are flawed. You can read some of my earlier articles on internal breadth which gives the same message; breadth is equal weighted.
Additional Necessary Information about Market Breadth
Dance with the Trend,
Greg Morris