 A couple of years ago I introduced a trend following technique which I first learned in the late 1970s. I thought this would be a good time to review it; especially since this technique is now available in StockCharts.com’s symbol catalog.
A trend follower’s lament:
“Only the market itself can tell you what to do. Everything else is irrelevant. While the irrelevant items tell you what the market ought to be doing, this may or may not be what it actually is doing.”
To determine what the market is doing compute the following:
1 - 5 week moving average of the NYSE Composite Index
2 – 15 week moving average of the NYSE Composite Index
3 – 40 week moving average of the NYSE Composite Index
4 – 15 week moving average of the NYSE advance decline line.
Zahorchak discusses the timing of the market because the primary trend tells you when to buy stocks and when to avoid them, however, it does not tell you when to sell them. Once stocks have been bought, their trend action tells you when to sell. Note: Keyword here is their. He then goes into the four basic market conditions.
1 – Bull market.
2 – Sideways periods in a bull market. He goes into considerable discussion on why investors make terrible decision during these types of markets.
3 – Bear market.
4 – Again, an uncertain period within a bear market. Again, much discussion about all the mistakes investors make during this period.
In the Table A below, +40 or –40 mean that the price is above (+) or below (-) the 40-week average. Up means the moving average is moving higher each week. Down means the moving average is moving lower.
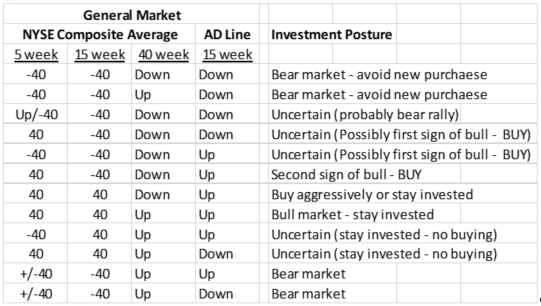 Table A
Please keep in mind that the Zahorchak indicators are my creation as there were no personal computers when Zahorchak created this system. I used a columnar pad for years until I get an Apple II computer. Chart A shows the original Zahorchak method using weekly data on the NYSE Composite Index and Advance – Decline Line. Visually it appears to do a reasonable job of identifying up trends when the indicator is near the top of the chart and down trends when it is near the bottom of the chart. I placed red lines at the +6, 0, and -6 levels to show how you could set this up as a model.
For example, whenever the indicator goes above -6 you can assume an uptrend is beginning. Complementarily, when the indicator drops below +6 you can assume the trend has reversed to the downside. It is also clear that near the 1995-95 bottom there were some false starts (whipsaws) and in 2001 there were even more. I’m not trying to give you a complete model, just want to show you the beginning steps. Plus, there are many other derivations of the Zahorchak measure as you see from Table B.
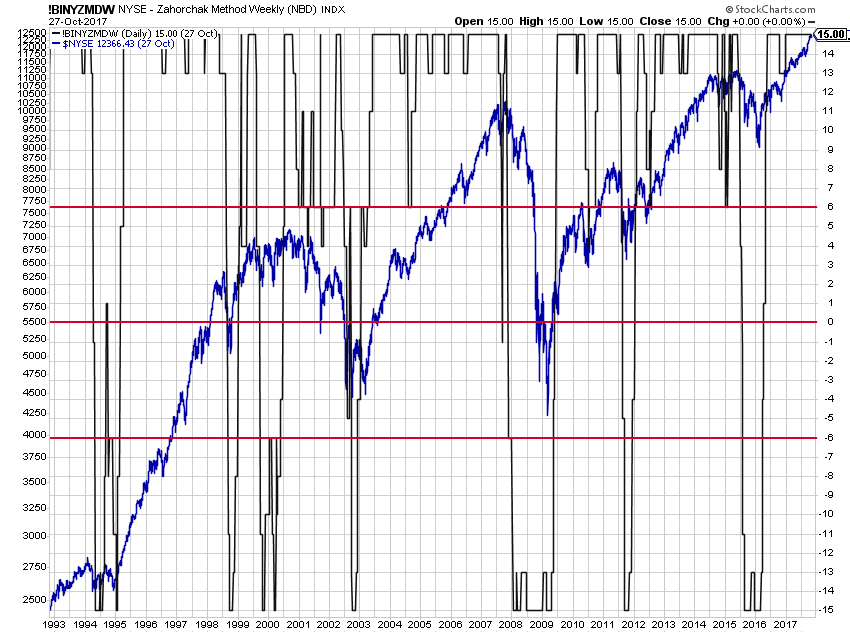 Chart A
The Zahorchak Measure symbols in Table B are available on StockCharts.com. There are daily versions, weekly versions, and an alternate calculation which I allude to below.
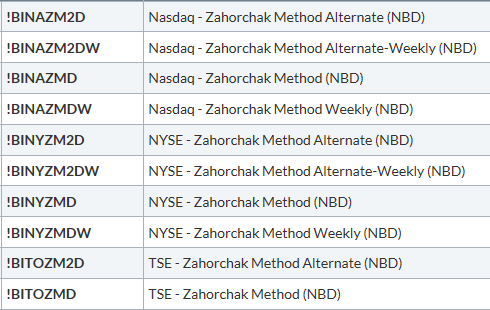 Table B
In the second edition of “The Complete Guide to Market Breadth Indicators” (there’s that sales pitch again), I explain how a miscalculation at one point in creating this indicator caused a much better indicator.
Dance with the Trend,
Greg Morris