 Wall Street is loaded with experts who make forecasts on the future market direction and market level many times a day. If you see a rather serious technical analyst on television, you can count on the talking head interviewer to ask him/her where the market is going. They must comply, or they won’t be asked back. The networks know their viewers want to hear forecasts. Years ago, I was on Fox Business and the talking head (won’t mention her name) said I see you like technology because it is in your portfolio. I responded that I did not particularly like technology. She said I needed to explain that. I stated that the technology ETF was rising in price and met my buying requirements. I did not buy it because it was technology. I bought it because it was performing well on a technical basis. I was never asked back.
There are a number of websites that track market forecasters and usually the collective result is something less than 50% are correct over time. Technical analysts are probably better at forecasting in the short term than the fundamental types and especially the economists. If you like to read forecasts, it is probably because you lack the confidence in your own analysis and you feel better when you find a forecast that aligns itself with what you think will happen. I hope you realize how sad that is. Have you investigated the forecaster’s track record to see if he/she has something of a successful record? Does this forecaster actually trade, and can he/she show you a validated record of trading? These are things you need to consider if you like to read forecasts. At the very least follow those you respect and believe have your best interests in mind. I would certainly stay away from those who are always on the financial media. StockCharts.com certainly has the best in the business.
Another type of analyst is demonstrated in Chart A. Here is the analysis: IBM closed the July gap down in November with a huge gapped up move. In early January the downtrend line was broken with a big move to the upside. That was soon followed by an island reversal in the middle of January. The previous support / resistance was met in the middle of February, with a volatile move to the upside which reached about 50% of the previous decline. So, how did I do? Was there anything I said in this analysis of IBM that helped you make money on this stock? Do you have a feel for where this stock might be headed from my analysis?
Of course not; all I did is tell you what happened in the past. If I was trying to educate you on gaps, island reversals, and trendline breaks, this might have made a good example. I call this aftcasting. Aftcasting is telling folks what has already happened. This is extremely common in newsletters, blogs, and especially wire house publications mislabeled as research. I’m sure you have received those multi-color expensive-looking booklets on what stocks to buy now and all the analysts reasons why they should be bought. They talk endlessly on new products from the company, new upper managers, and of course, they tell you the earnings forecast. This is not research; this is marketing.
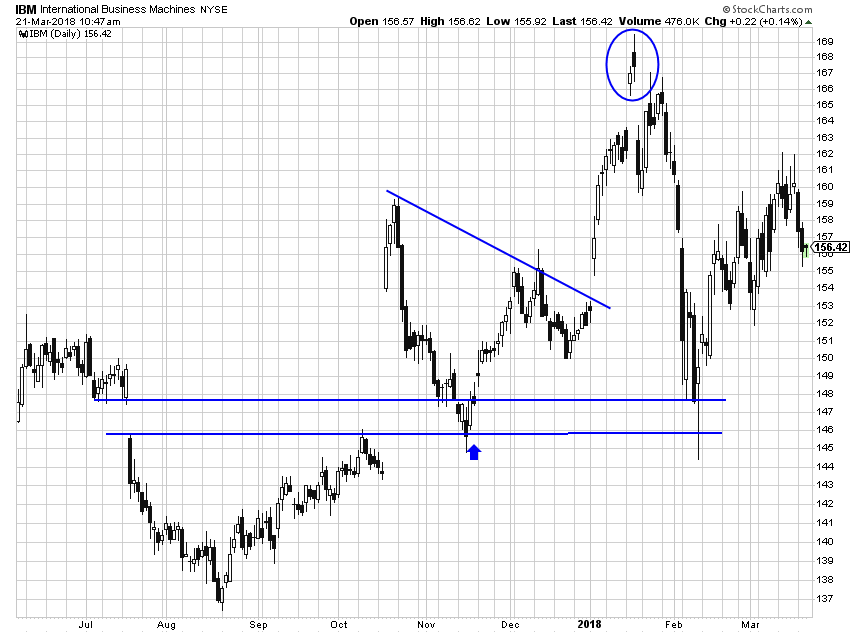 Chart A
I thought I was being cute with the word aftcasting; then I searched and found it has been used before. Rarely in a technical analysis situation, however; mostly in portfolio analysis and efficient frontier; both of which I don’t know much about (or care that I don’t). Somewhat like Monte Carlo which displays a giant range of potential outcomes. I wrote in an earlier article that if someone shows you a Monte Carlo simulation, it is because they also believe the market is random and normally distributed. In any case, I wanted to ensure you realize when someone is teaching you something versus someone who is making a forecast. The beauty of a rules-based process is that you don’t have to listen to either.
Dance with the Trend,
Greg Morris