 This article is a follow up of the previous one in this series - Building a Rules-Based Trend Following Model - 6. Table A is an example of the detailed research behind each of the various indicators used in the weight of the evidence. This example uses over 30 years of data; however, it should be run over many different periods to find consistency. Table A is the performance data for the Price Long indicator.
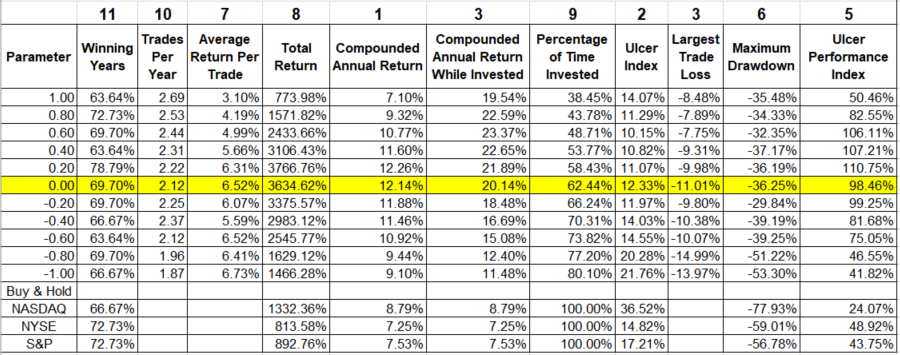 Table A
While the calculation of all the various measures of an indicator’s ability to work over a vast number of trials and time segments, one still has to determine “where’s the beef?” Of all that data generated, shouldn’t you list the categories from best to worst inasmuch as their contribution to what you looking for? I think so, definitely so. One method and the one I use is to ask some sharp folks who are deeply familiar with the indicator and the output to give me their input as to the order in which the parameter analysis should be viewed. And to keep this as a robust process, it is done each year. Often there isn’t much change, but sometimes someone gets a more involved feeling after working with these almost every day as to which is more important than another. Sometimes the overall relative ranking of these gets changed. The top row of numbers in Chart A is the ranking of importance of each of the performance measurements. Clearly, returns and risk are the most important. You will notice in this example that two parameters (Return while invested and Largest Trade Loss) are tied in their informational value. Anticipating the questions as to why the parameter of 0.20 isn't better than 0.00; remember I'm only showing you a sample. The actual analysis involved many runs over different time frames.
Here is an explanation of the various parameters in Table A:
Parameter – these are the variable parameters used to test the indicator’s usefulness in identifying trends. They can be discovered by optimization, or just a visual analysis of the indicator. They are then spread about to cover a wide range of analysis for the indicator. Currently this indicator uses 0 (zero) as it signal line (yellow shading); but you can see by moving the signal point up or down, how the performance measures change.
Winning Years – the percentage of years that the trading ended higher than the close from the previous year.
Trades Per Year – this is the number of closed trades per year.
Average Return Per Year – determined by looking at the total return for the entire run, and then dividing it by the number of years.
Total Return – the total return from the system using the selected parameter.
Compounded Annual Return – the gain each year that would be required to achieve the total gain for the analysis period.
Compounded Annual Return While Invested – the annual gain that would be required to achieve the total gain, excluding cash positions, over the period being analyzed.
Percentage of Time Invested – the percentage of time that actual trades were placed and not in cash.
Ulcer Index – a measure of downside volatility also covered in the ranking measure section of this book.
Largest Trade Loss – a single trade that resulted in the largest loss.
Maximum Drawdown – the maximum decline of the system measured from the highest level that the system had reached. Keep in mind this is a one-time isolated event.
Ulcer Performance Index – the compounded annual return divided by the Ulcer index, this is a performance measure similar to the Sharp ratio, the Sortino ratio, and the Treynor ratio. All are risk adjusted measures of performance.
The above performance statistical information provided for the Price Long weight of the evidence measure will not be included in all of the indicators that are used as this series would get overly long. However, when something stands out that will provide additional insight into this process; the information will definitely be shown. However, do not fear; a chart or two will be shown for each measure.
Dance with the Trend,
Greg Morris