 In my previous article called Weight of the Evidence (WoEv) I compared my Weight of the Evidence with Tushar Chande’s Chande Trend Meter (CTM). I also mentioned I was happy that Tushar had this indicator since I cannot divulge the exact details of my Weight of the Evidence. A large difference between my WoEv and Tushar’s CTM is that I use market breadth AND price-based measures and Tushar only uses price-based measures. At market tops (periods of distribution) I strongly believe breadth can offer an early warning to impending weakness in the markets. This is because most indices are either capitalization weighted or price weighted (Dow Industrials), which means they mostly reflect the performance of the large capitalization issues, which does not always reflect the overall market. I’ll expand on that in a future article. Charts A and B below show the bear market that lasted from October 2007 to March 2009. Chart A was in the previous article and shows the CTM (blue) and WoEv (red) from 8/2007 to 5/2009 along with the Nasdaq Composite (black).
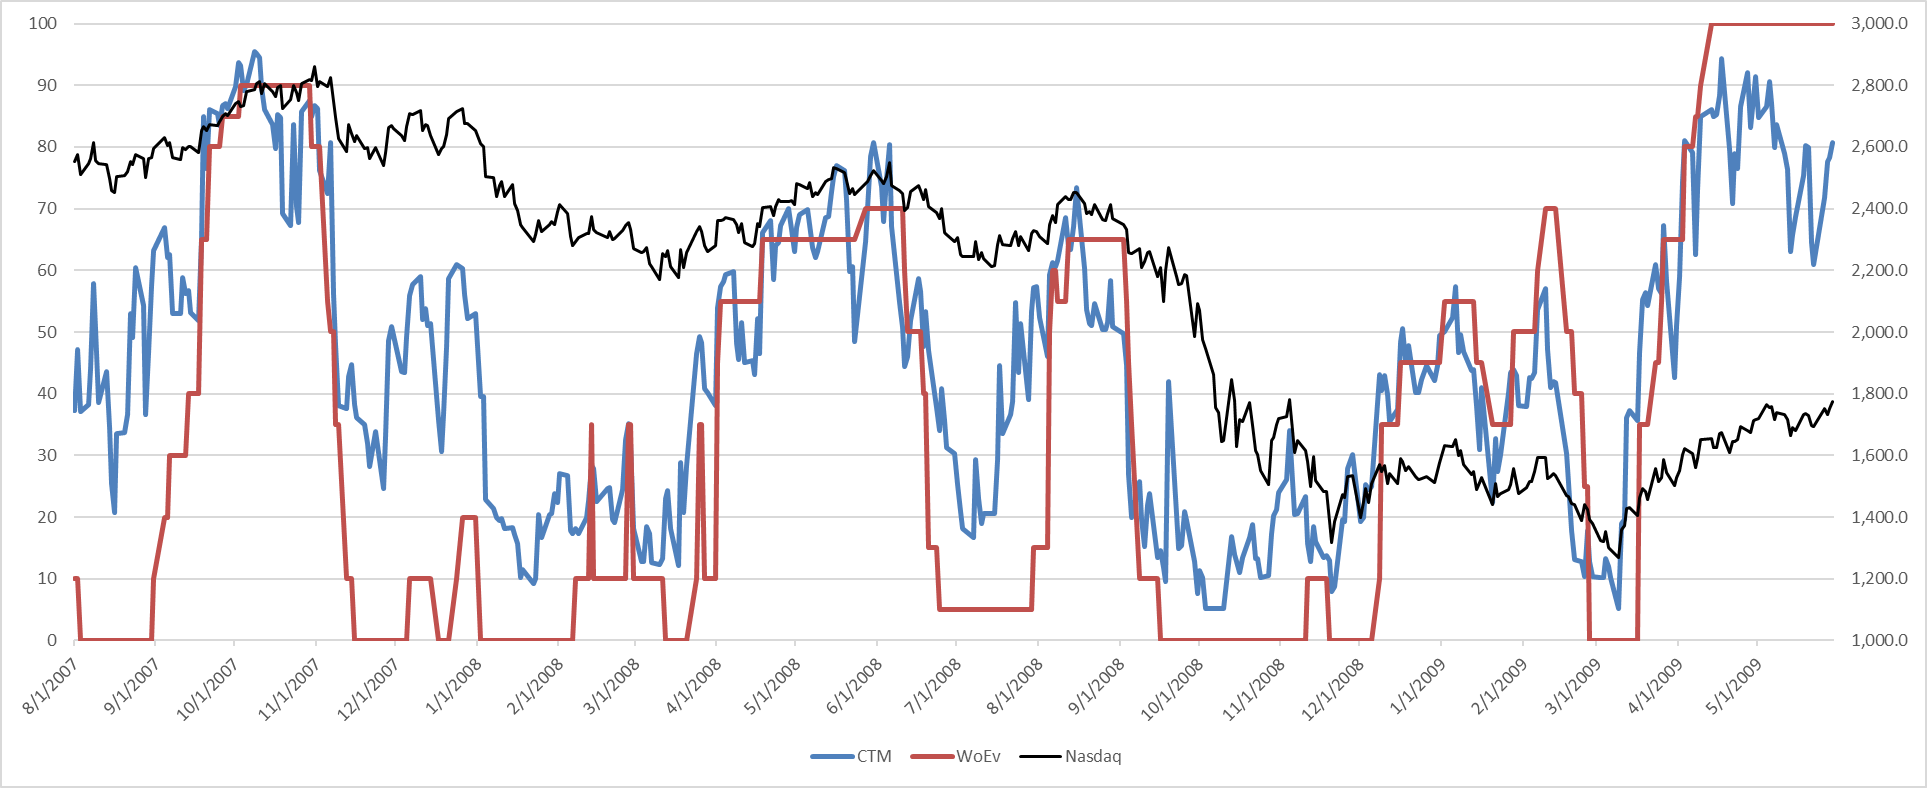 Chart A
In Chart B I have smoothed CTM with a 5-period exponential average. This greatly reduces the noise and, in my opinion, makes it more useable for a trend model. Comparing Charts A and B, you can easily see the reduced oscillations in CTM (B) because of the 5-period exponential smoothing.
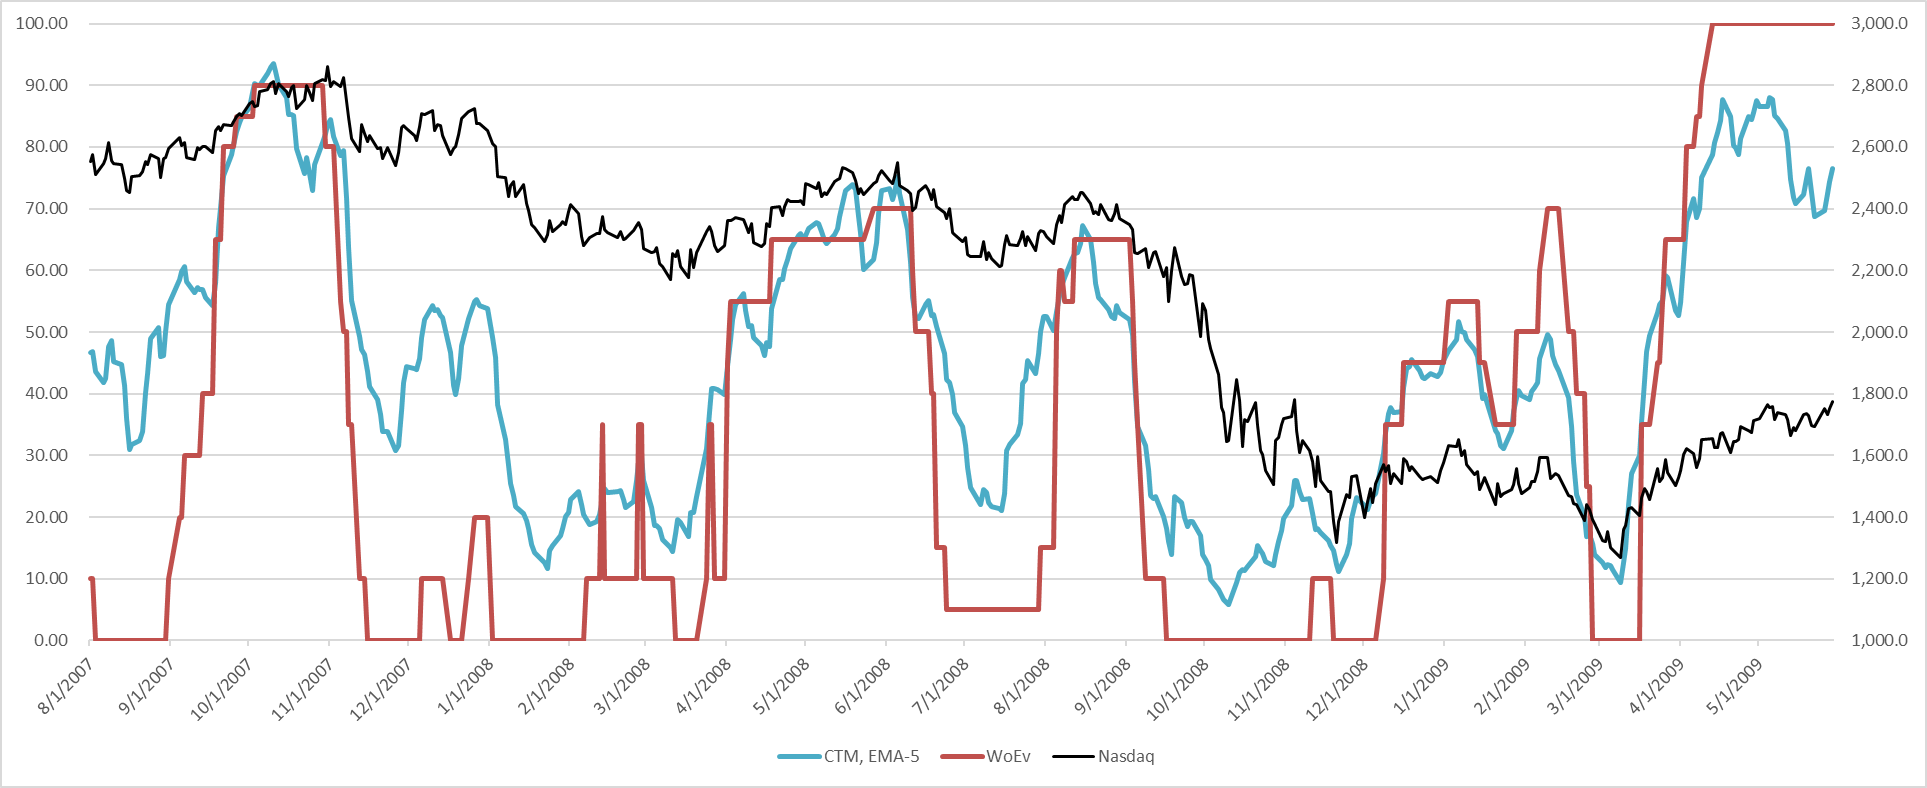 Chart B
Now let’s look at some of the differences between the smoothed CTM and my WoEv in Chart B. You can see at the beginning of the chart (August 2007), and again in December 2007 - January 2008 CTM shows considerably higher readings than WoEv. This is likely due to the WoEv incorporating breadth and getting an earlier reading on the deterioration of the uptrend than CTM. In May of 2009 CTM is declining because of slight downward moves in the market, yet WoEv is holding steady at 100. Again, this difference is partially a result of including market breadth in my measure of uptrends. Even with the smoothed version of CTM, WoEv appears more definitive in its signals. When managing large sums of money definitive signals are paramount. You do not want to be put into a situation where you say things like, “well it is very close, but not quite there.” This of course can still happen with my digital WoEv, but not nearly as often.
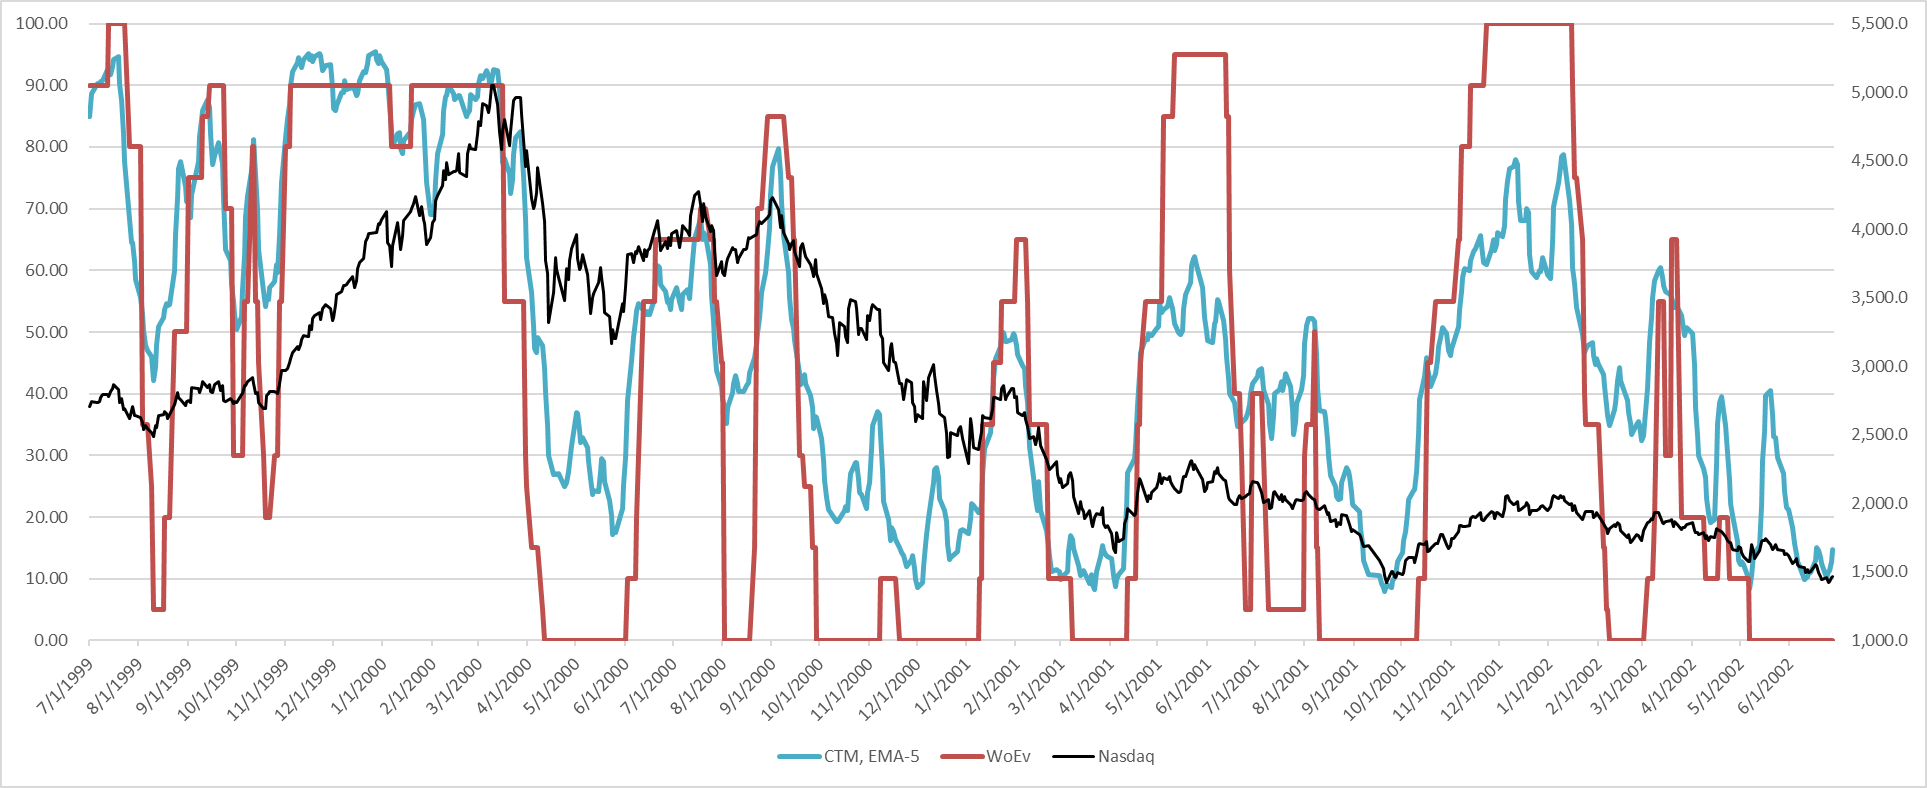 Chart C
Chart C is the earlier bear market from 7/1999 to 6/2002. Again, I’m showing my WoEv in red and Chande’s CTM, smoothed exponentially by 5-periods, in blue. They are very close in this example; the only big exceptions are in June 2001 and January 2002 where CTM does not reach the height that WoEv. Height in my model controls asset commitment.
I think I will spend some time with CTM and see if I can come up with a version that has discrete readings, instead of continuous, so that it can more easily be implemented as a trend following model to manage money.
Dance with the Trend,
Greg Morris