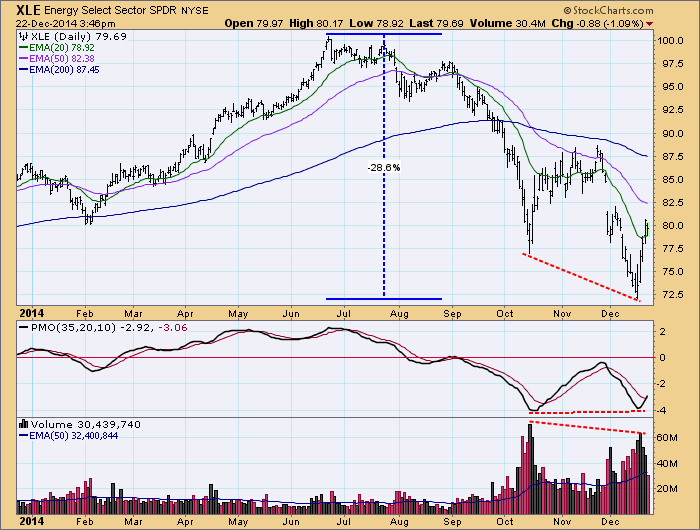
A few weeks ago we looked at the possibility that the Energy SPDR (XLE) was setting up for a double bottom, which, unfortunately did not happen. More recently it has rallied strongly off the low of the XLE bear market, with a PMO positive divergence and contracting volume at the low. This is certainly a good start, but we do wonder about the underlying fundamentals.
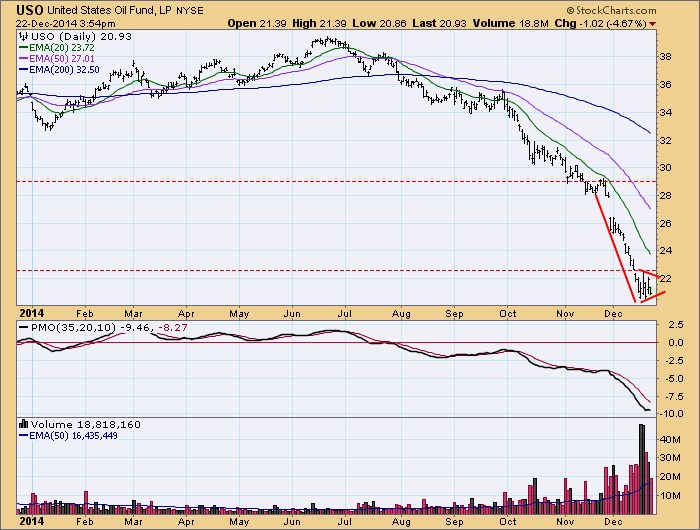
While energy stocks are rallying, the Oil ETF (USO) has gotten no bounce at all. Instead, USO has moved into a bearish reverse pennant formation, and the pennant is just below the long-term support line (now resistance).
The weekly chart of USO gives a better perspective, showing the violation of long-term support; however, we are not sure that USO is the best for measuring psychological levels of support and resistance. The bottom panel ($WTIC) shows the actual price of oil, and we can see that current price is well above the important 2009 low, which was at about $35. More significant, we think, is the support line drawn across the top of the cluster forming the 2009 low, which is at about $48-50, not far from current prices.
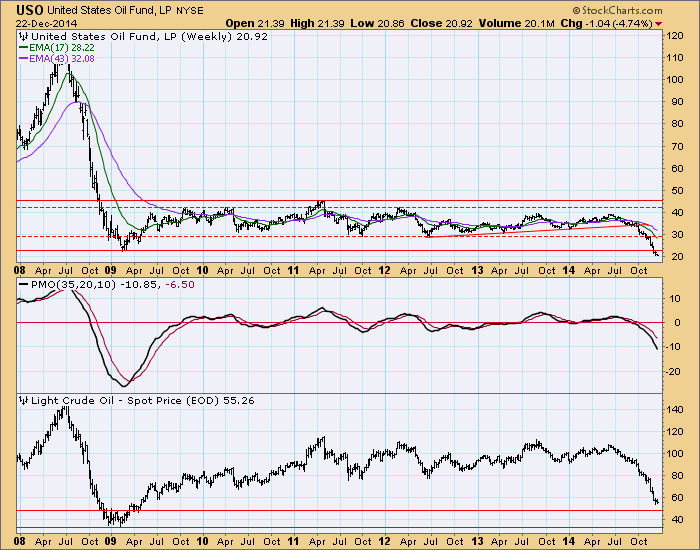
Conclusion: The rally in energy stocks is not yet backed up by the price of crude, so we have to assume that it is a bear market rally. The reverse pennant on the USO chart implies that crude has farther to fall, but the $WTIC chart offers some hope that the bottom may come at around $50/bbl.