DecisionPoint August 29, 2015 at 11:40 PM

In the last two weeks the stock market put on quite a show. Many months of sideways boredom was finally ended with a dramatic breakdown and a scary drop of -14.4% (intraday for SPY) from the all-time high in July. From that low, SPY then rebounded nearly +10%... Read More
DecisionPoint August 27, 2015 at 08:30 PM

I spent a good portion of my Wednesday webinar, DecisionPoint LIVE! discussing "Bear Market Rules"... Read More
DecisionPoint August 25, 2015 at 07:53 PM
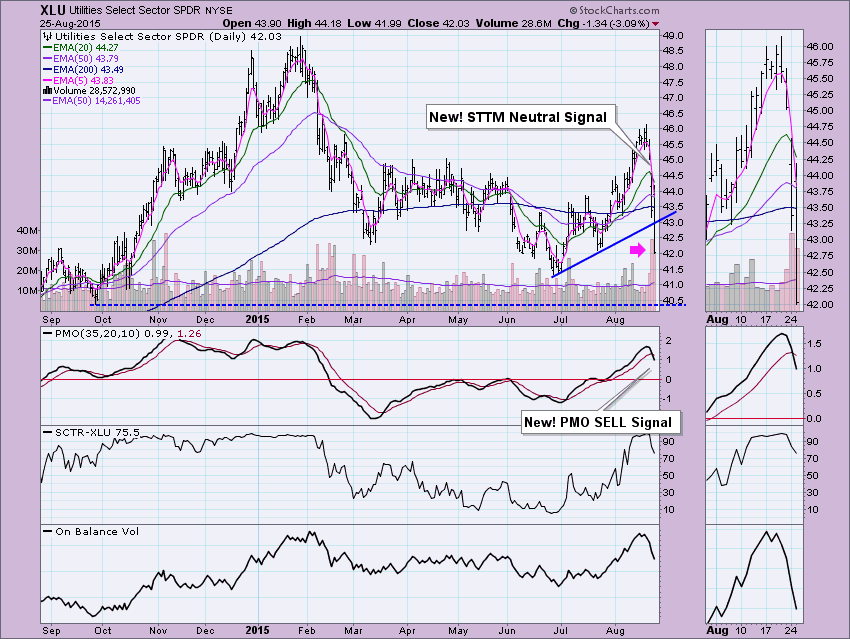
I receive technical alerts whenever there are DecisionPoint signal changes on the ETFs and Indexes that we cover in the DecisionPoint Market/Sector Summary. Today, while there were only a few, they were centered around the Utilities sector... Read More
DecisionPoint August 24, 2015 at 01:38 PM
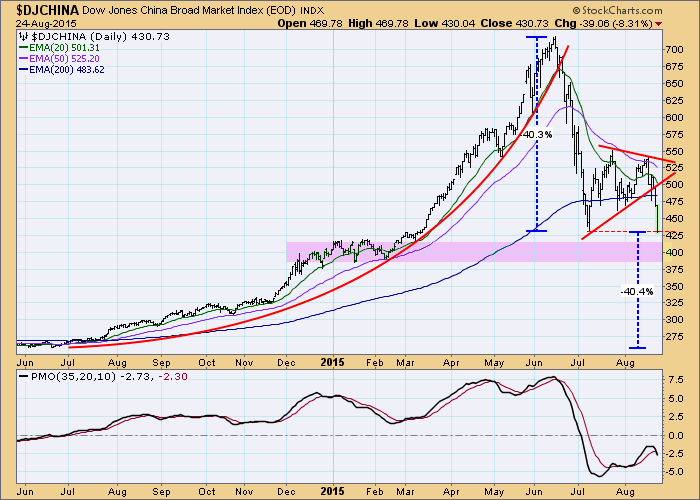
In early August I wrote an article about China's stock market crash, wherein I stated, "It is incomprehensible to me that such action in China will have no effect elsewhere in the global financial markets... Read More
DecisionPoint August 20, 2015 at 05:13 PM
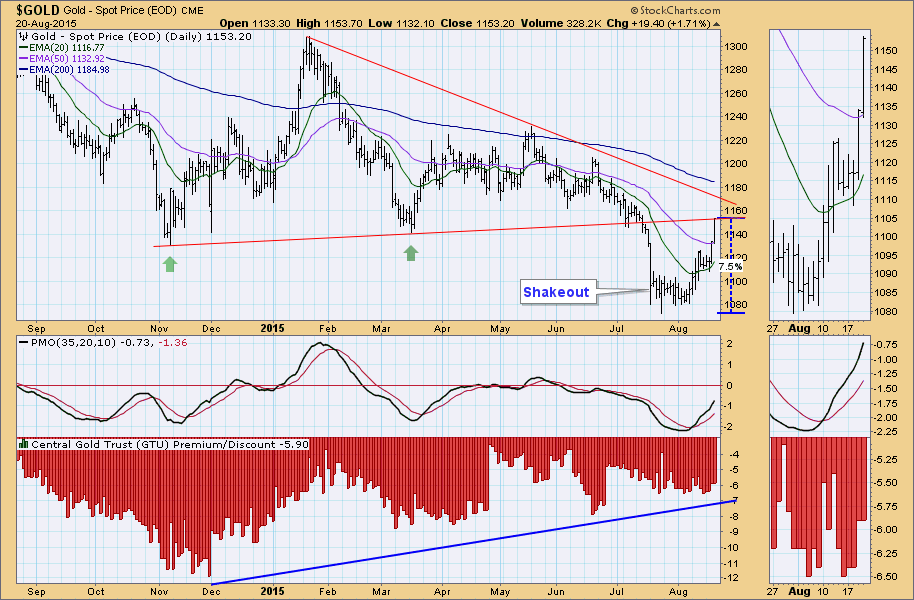
After months of sagging prices, gold ($GOLD) is finally coming back to life. From the July low it has rallied +7.5%. After a promising November/March double bottom, the subsequent rally failed, support was broken, and new lows were made in July... Read More
DecisionPoint August 18, 2015 at 03:00 PM
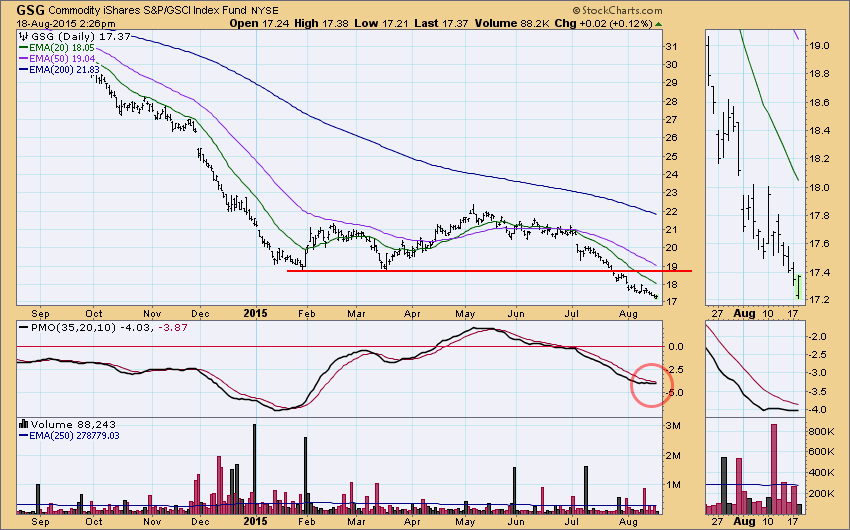
I have seen a couple of comments around the Internet speculating that a big commodities rally is coming. Let's look at a few charts to see if there is anything to back that up. We'll use the Commodities iShares (GSG) as a surrogate for commodities... Read More
DecisionPoint August 16, 2015 at 11:20 AM
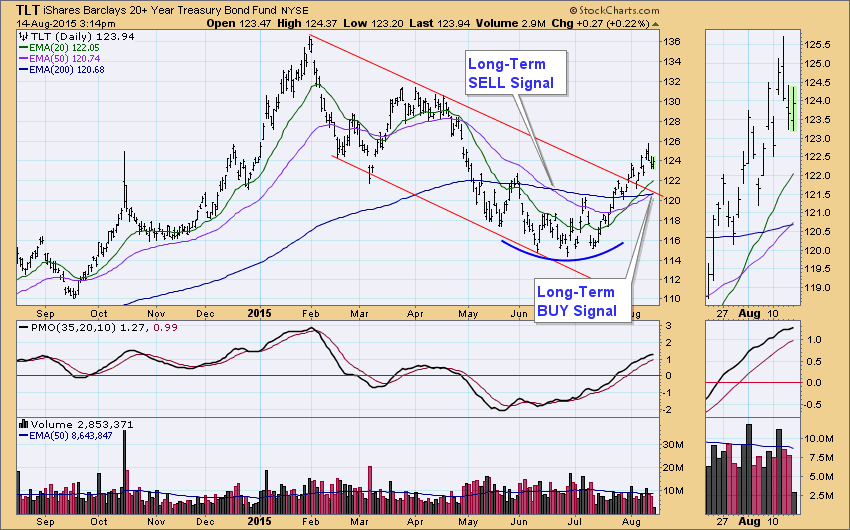
At the end of June I published an article showing where bonds (TLT) had generated a Trend Model long-term SELL signal when the 50EMA crossed down through the 200EMA; however, as of Friday's close the 50EMA crossed back up through the 200EMA, generating a long-term BUY signal... Read More
DecisionPoint August 13, 2015 at 08:18 PM
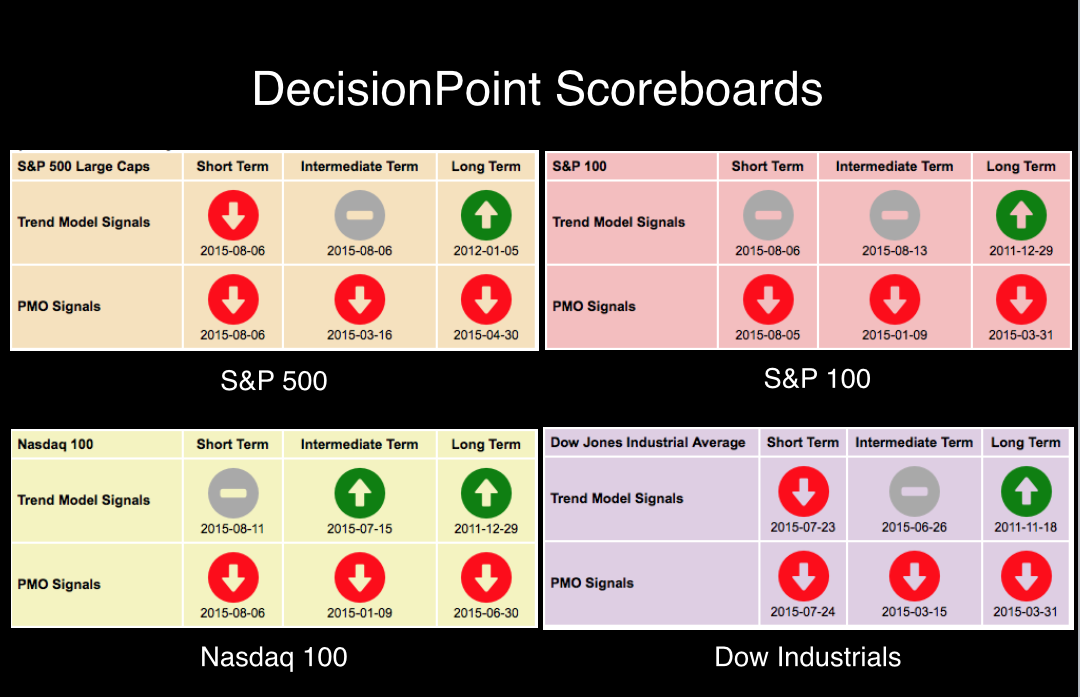
The DecisionPoint Scoreboard had an important signal change on the OEX... Read More
DecisionPoint August 11, 2015 at 08:25 PM
Market action has been volatile but sideways. It's killing our shorter-term indicators and timing models. The DecisionPoint Trend Model generates BUY/SELL/Neutral signals based on the position of the 5/20/50/200-EMAs... Read More
DecisionPoint August 08, 2015 at 11:30 PM
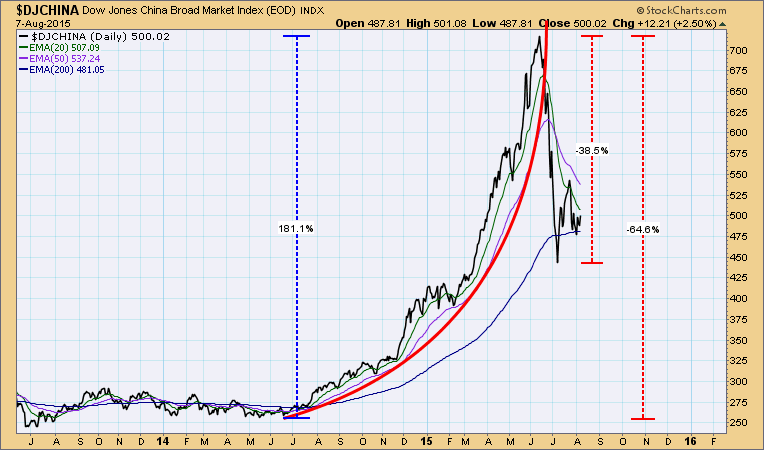
The Chinese stock market made news recently, dropping nearly -40% from its June top to a low in early July. With that market having bounced off the crash low, many are saying that the decline is over, but I think that assessment is premature... Read More
DecisionPoint August 06, 2015 at 08:37 PM

This week the $SPX has been flip-flopping more than a sleazy politician. The Short-Term Trend Model (STTM) went from a BUY on Monday to Neutral on Tuesday to a BUY on Wednesday and today to a SELL signal. Ugh. There was a difference today... Read More
DecisionPoint August 04, 2015 at 09:05 PM

I'm sorry I simply couldn't resist the pun. Tom and Greg always seem to be having all the fun with their "punny" headlines so it's my turn. Apple could be entering correction mode. The question is whether it is only a short-term proposition... Read More
DecisionPoint August 01, 2015 at 11:27 PM
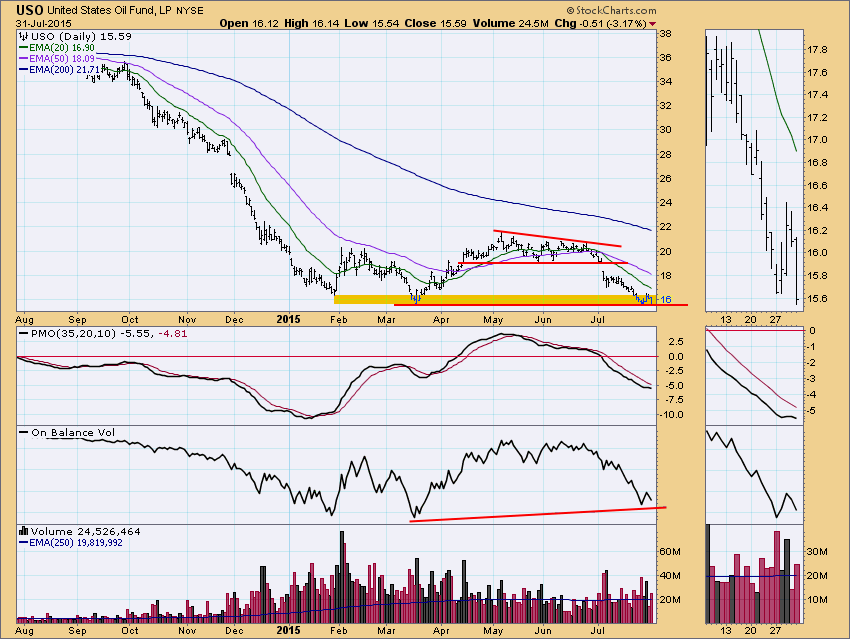
The price of crude oil is certainly getting a lot of headlines, but, as usual, we need to look at some charts to get the true picture. Our surrogate for crude is the U.S. Oil Fund ETF (USO), which reflects the price of oil less the costs of actually rolling over the contracts... Read More