DecisionPoint September 29, 2015 at 07:16 PM
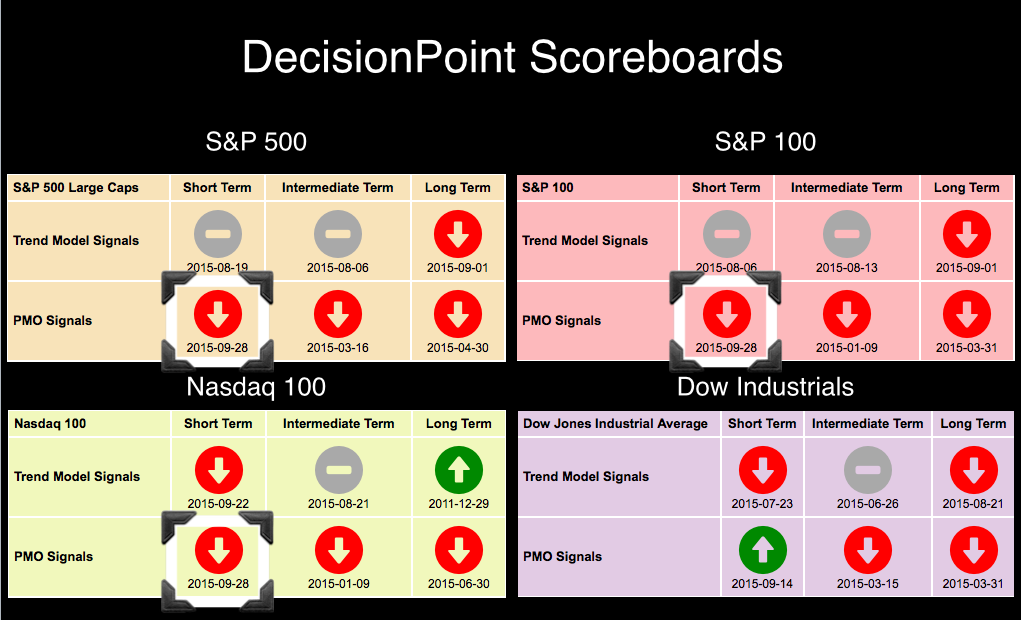
I noted yesterday that the NDX, SPX and OEX all had Short-Term Price Momentum Oscillator (PMO) crossover SELL signals. The DecisionPoint Scoreboard is below... Read More
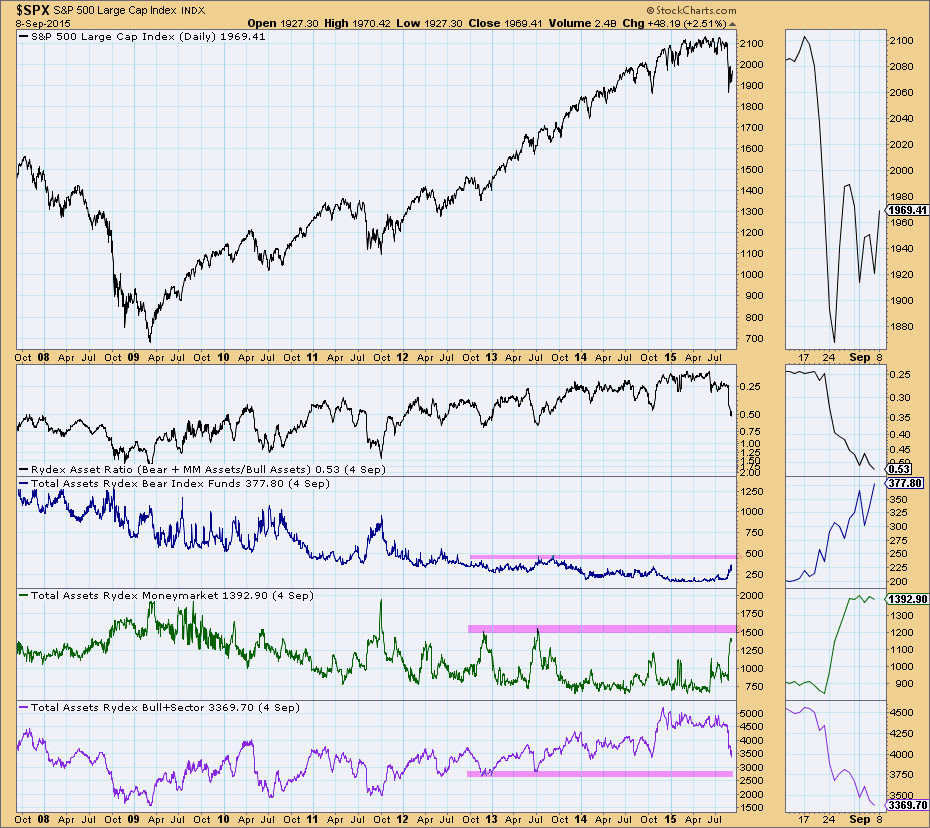
DecisionPoint September 26, 2015 at 11:38 PM
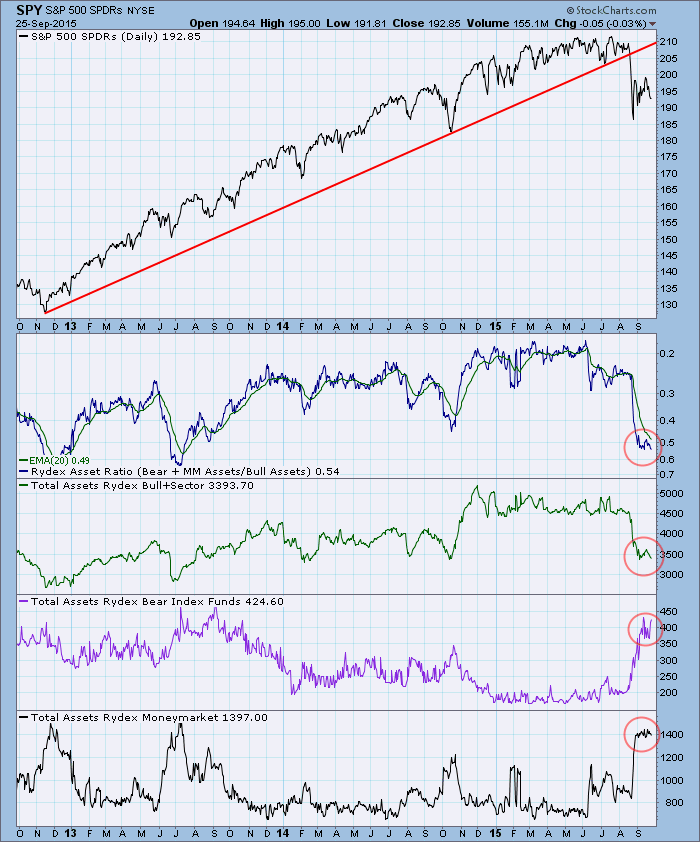
The Rydex Asset Ratio is a solid sentiment indicator because it is based upon an analysis of where people are actually putting their money, not just how they are feeling about the market... Read More
DecisionPoint September 22, 2015 at 07:51 PM
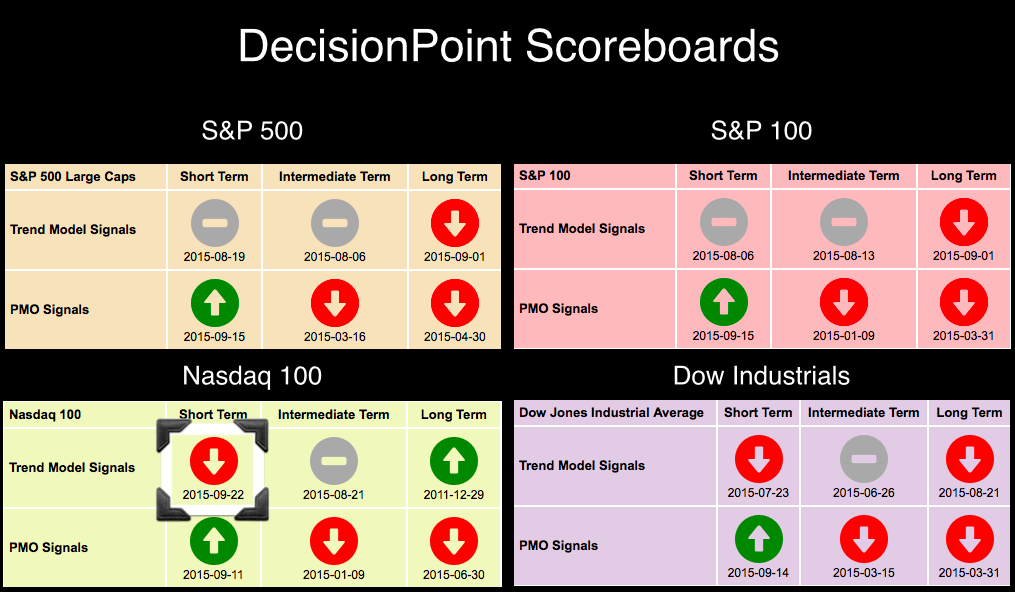
The Nasdaq 100 (NDX) has been the leading index for the recent rally. It was the first to move from short-term Neutral and SELL signals to BUY signals on the DecisionPoint Scoreboards... Read More
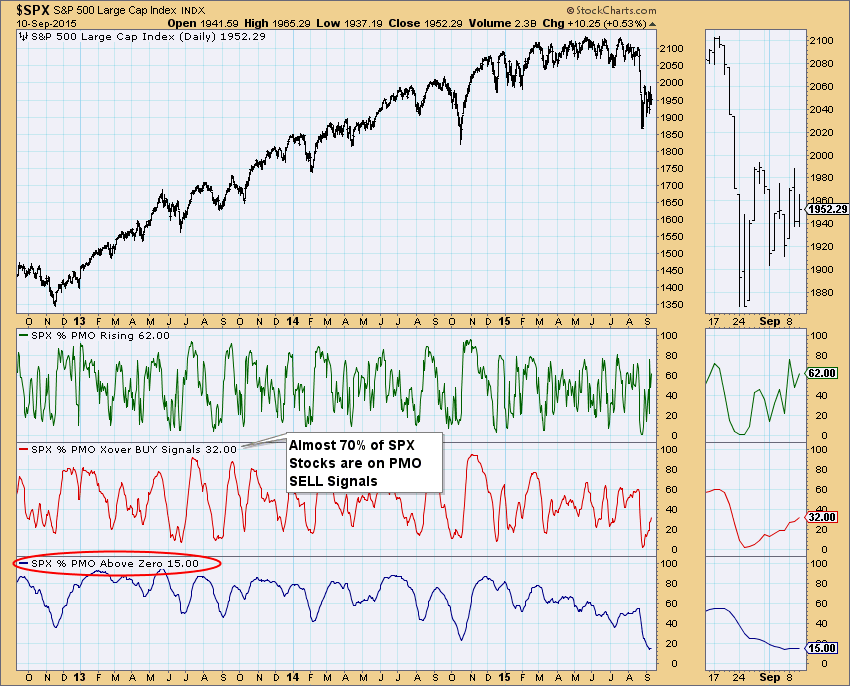
DecisionPoint September 20, 2015 at 10:00 AM
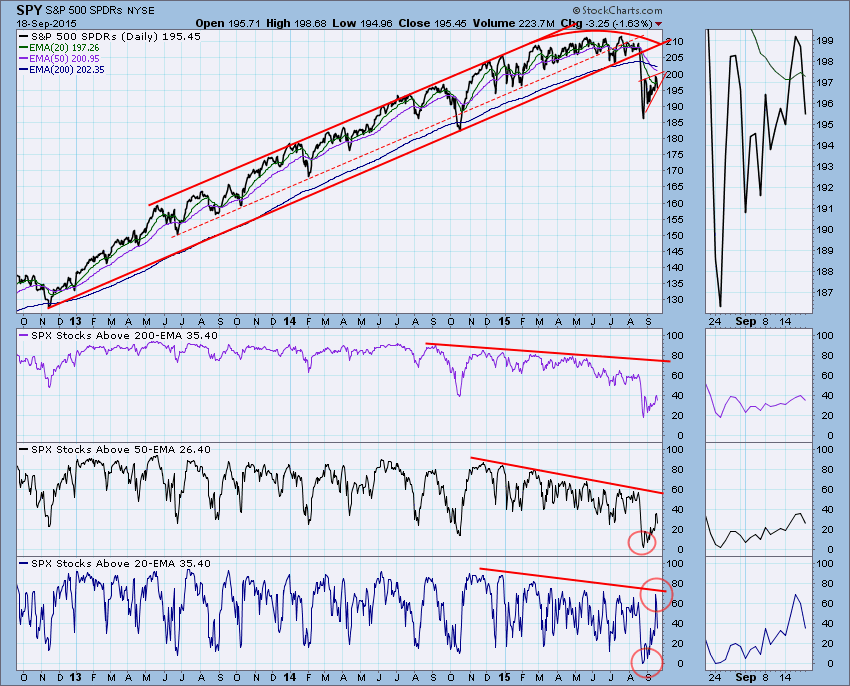
We track the percentage of stocks above their 20EMA, 50EMA, and 200EMA because this helps us determine market condition in the short, medium, and long time frames... Read More
DecisionPoint September 17, 2015 at 07:06 PM
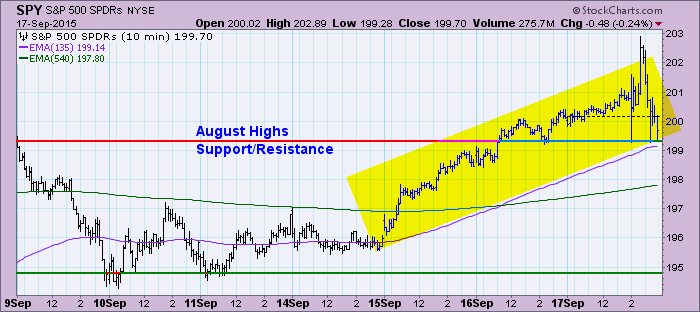
The SPY in the last three days has been trending higher, so expectation would be that short-term indicators would reflect that strength. They are currently deteriorating or pointing to internal weakness... Read More
DecisionPoint September 15, 2015 at 08:54 PM

According to the glossary in ChartSchool, the definition of a Bull Trap: A situation that occurs when prices break above a significant level and generate a buy signal, but suddenly reverse course and negate the buy signal, thus “trapping” the bulls that acted on the signal with l... Read More
DecisionPoint September 13, 2015 at 11:45 AM
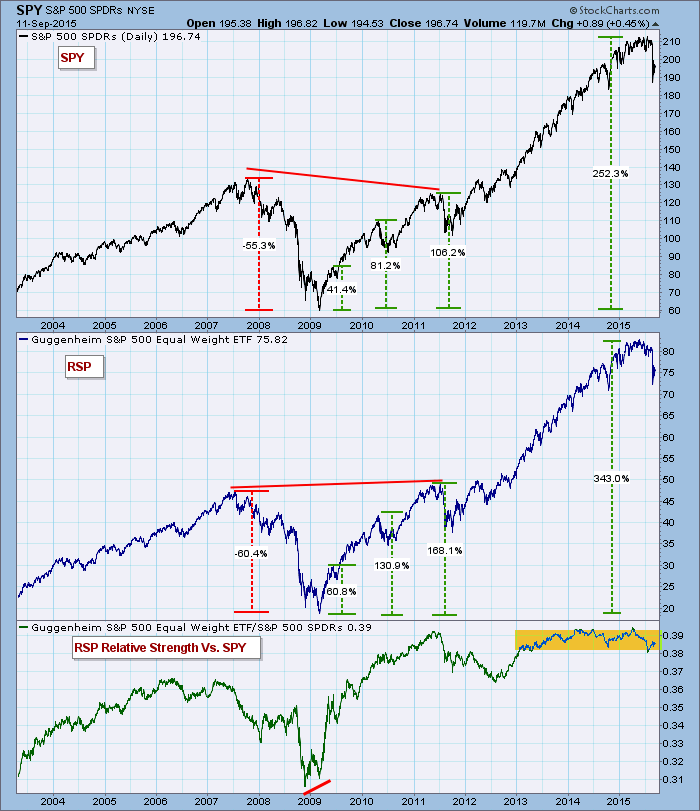
Last week I highlighted CVI and Participation Index readings I had never seen before. This week I want to point out some useful relative strength behavior I just noticed for the first time. My focus is on the S&P 500 SPDR (SPY) and the S&P 500 Equal Weight ETF (RSP)... Read More
DecisionPoint September 10, 2015 at 07:03 PM
I think most are in agreement that we are now in a bear market. As far as DecisionPoint models are concerned, we definitely are. When the 50-EMA crosses below the 200-EMA, we consider that ETF/Stock/Index/MF to be in a "bear market"... Read More
DecisionPoint September 08, 2015 at 08:08 PM
As part of a comment on Friday's DecisionPoint Alert, I was asked to review the DecisionPoint sentiment charts... Read More
DecisionPoint September 06, 2015 at 01:53 PM
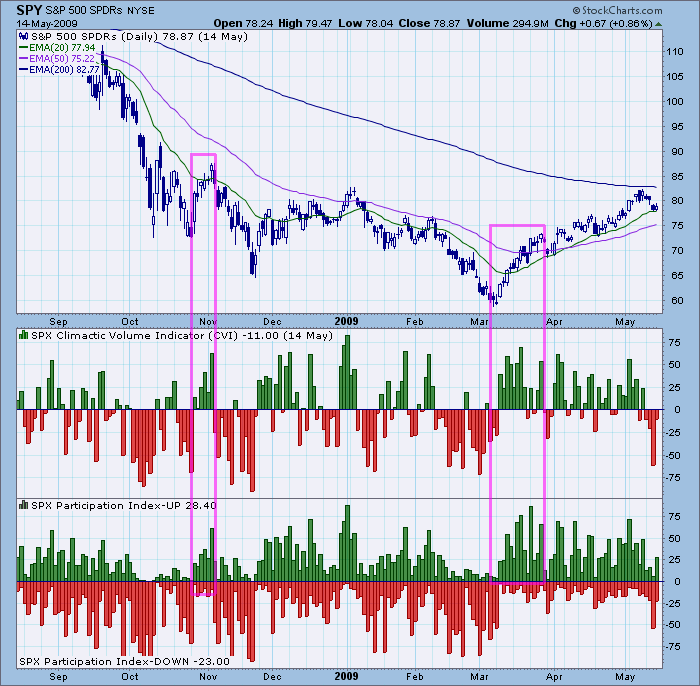
In the last two weeks I observed something I don't recall ever seeing before. Two market indicators, that I never fail to review at the end of every trading day, are the Climactic Volume Indicator (CVI) and the UP and DOWN Participation Indexes (PI)... Read More
DecisionPoint September 03, 2015 at 08:25 PM

Every day, we publish a complete Market/Sector Summary in the DP Reports Blog. Not many are aware of its usefulness or even its existence! I publish an excerpt from that report every day in the DecisionPoint Alert day's analysis blog... Read More
DecisionPoint September 01, 2015 at 08:25 PM

We had two VERY important signal changes today! Both the S&P 500 and S&P 100 generated Long-Term Trend Model SELL signals. This is very serious, especially given that the Dow Industrials already received a LT SELL signal on August 21st... Read More