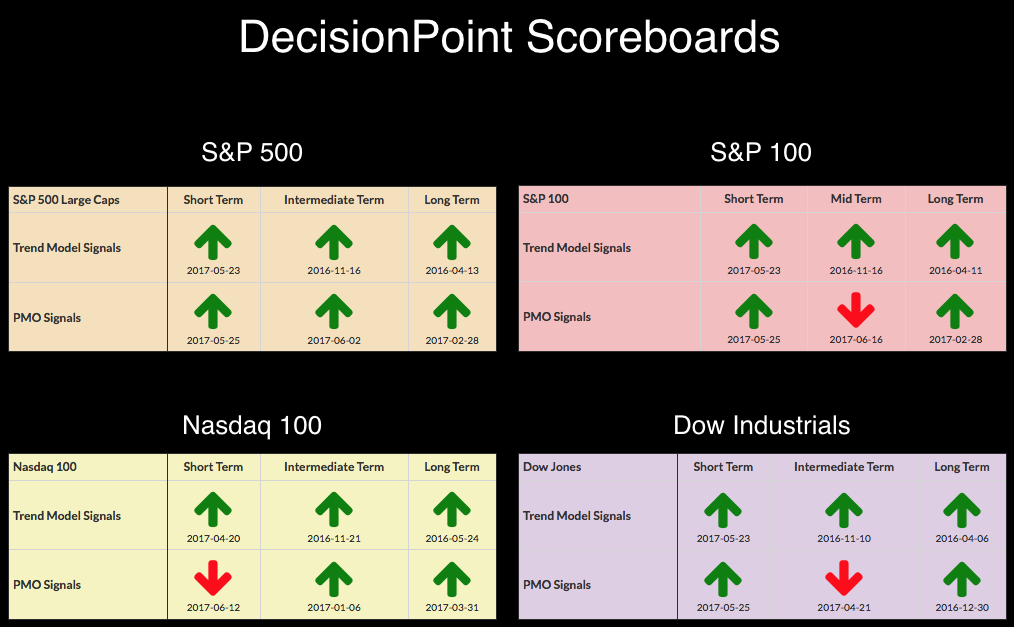
No new signals yet on the DecisionPoint Scoreboards, but with index PMOs in decline, I suspect we will see some more if the bulls can't get a rally to stick. Last Friday, the OEX weekly PMO had a negative crossover SELL signal.
The purpose of the DecisionPoint Alert Daily Update is to quickly review the day's action, internal condition, and Trend Model status of the broad market (S&P 500), the nine SPDR Sectors, the U.S. Dollar, Gold, Crude Oil, and Bonds. To ensure that using this daily reference will be quick and painless, we are as brief as possible, and sometimes we let a chart speak for itself.
SIGNALS: Here we include charts of any important signal changes triggered today by our Intermediate-Term Trend Model.
NO NEW SIGNALS TO REPORT.
NOTE: Mechanical trading model signals define the implied bias of the price index based upon moving average relationships, but they do not necessarily call for a specific action. They are information flags that should prompt chart review. Further, they do not call for continuous buying or selling during the life of the signal. For example, a BUY signal will probably return the best results if action is taken soon after the signal is generated. Additional opportunities for buying may be found as price zigzags higher, but the trader must look for optimum entry points. Conversely, exit points to preserve gains (or minimize losses) may be evident before the model mechanically closes the signal.
STOCKS
IT Trend Model: BUY as of 11/15/2016
LT Trend Model: BUY as of 4/1/2016
Yesterday saw an encouraging rally that ended at all-time highs. Today a smaller gap down and steep declining trend channel nearly erased all profit as the original gap up began to close.
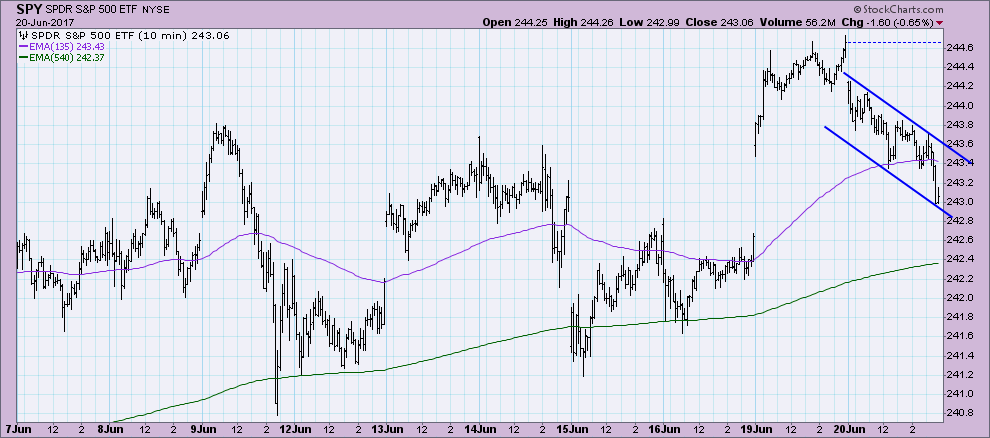
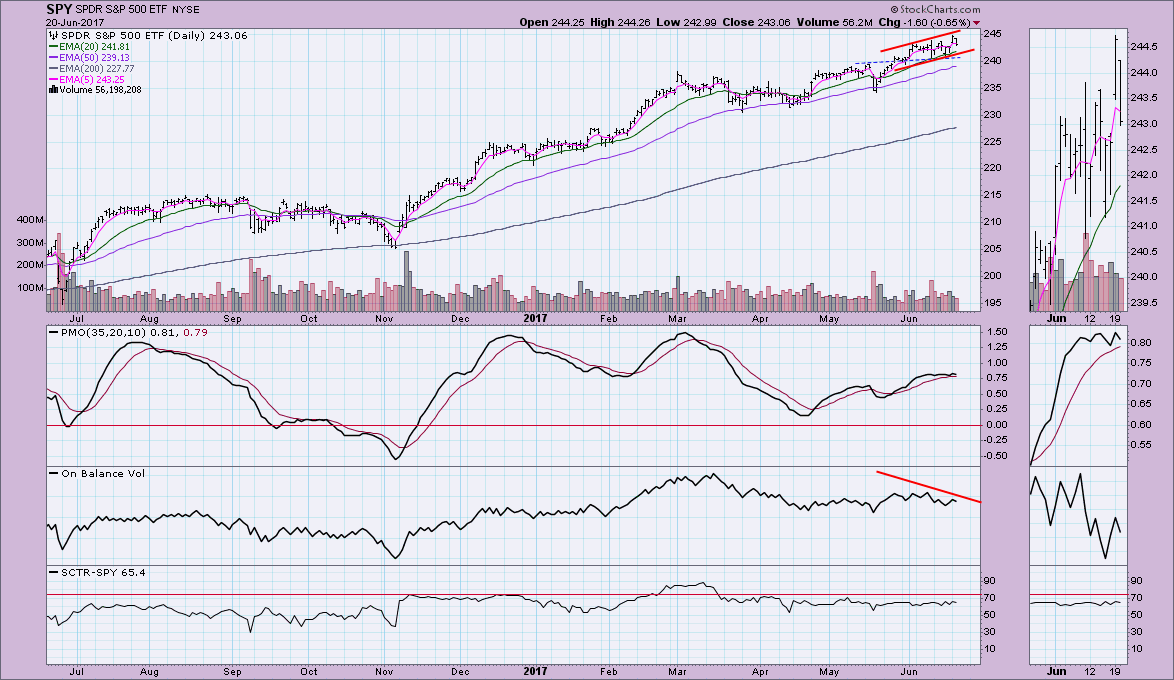
A gently rising trend channel is visible on the SPY, but we do note the indecisive PMO. The PMO will travel sideways when acceleration in one direction or the other doesn't change much. The OBV has a very negative divergence set up between price tops and OBV tops. The SCTR remains healthy.
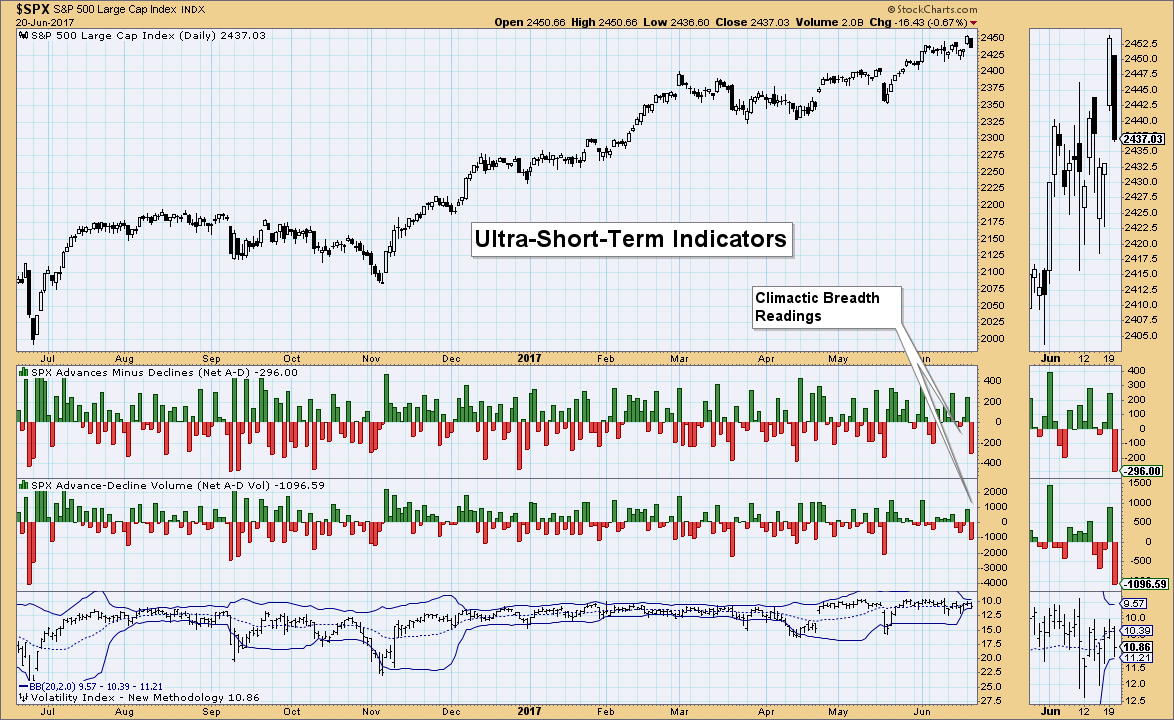
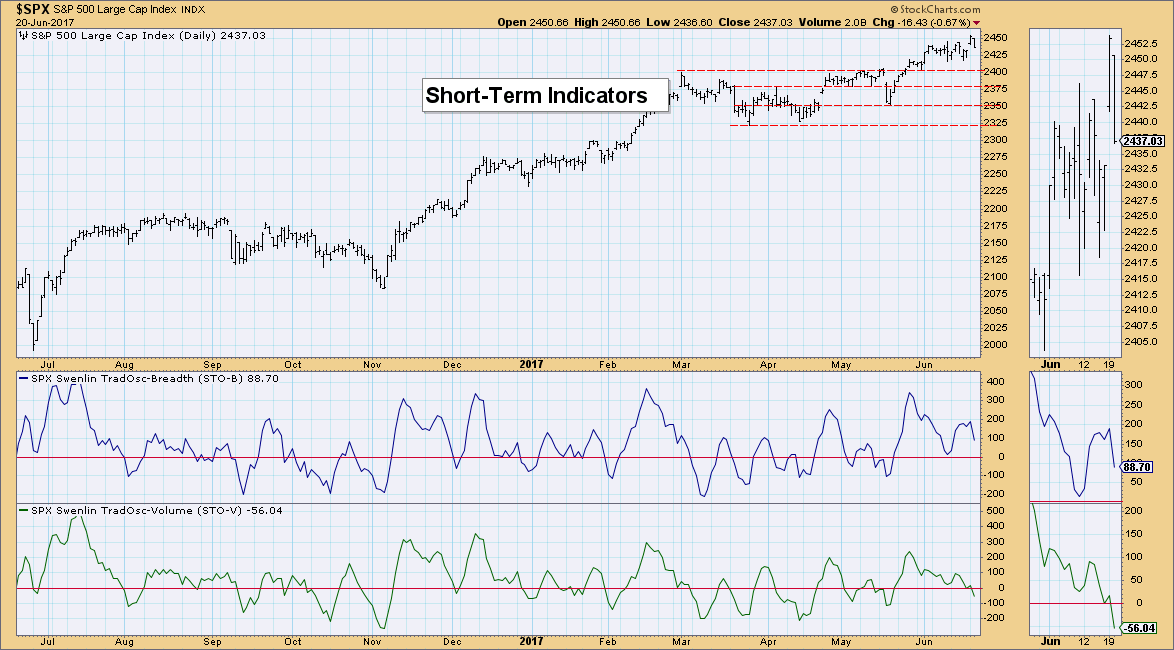
Ultra-Short-Term Indicators: We saw climatic readings on Net Advances-Declines and Net Advancing Volume-Declining Volume. Given this is the first black candle after three white, I would see this as an initiation to lower prices in the very short term. The VIX is no help as it has flattened and Bollinger Bands have shrunk to nothing.
Short-Term Indicators: Since the last overbought top on these indicators, they have spent most of the time unwinding as price consolidated. The STO-V is getting oversold, but not the STO-B. These declining indicators suggest downside or at least consolidation in the short term.
Intermediate-Term Indicators: The ITVM has had a negative crossover, but not the ITBM. While I'm concerned that these indicators are topping, the rising trend on both hasn't been broken yet. The ITBM is near-term overbought, so a decline wouldn't be out of the ordinary in this space. That's what concerns me, a vulnerable ITBM. I'm reading these indicators as cautionary right now, but if we get a negative crossover on the ITBM, it will be time to get bearish in the intermediate term.
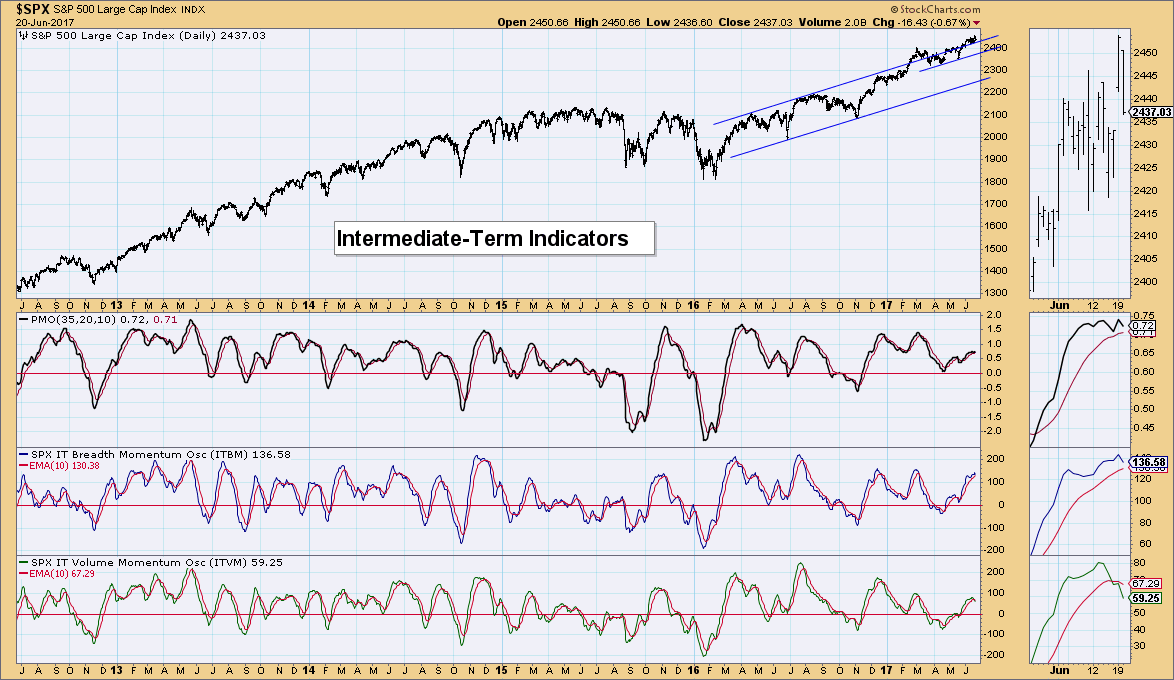
Conclusion: Short-term indicators are bearish and intermediate-term indicators are starting to get bearish. I would expect a minimum of more consolidation out of the S&P 500. Similar negative indicator activity has been occurring since last November and each time we've seen minimal pullbacks and mostly consolidation. If the intermediate-term indicators get more bearish, then I'll expect at least a pullback to the 2400 level.
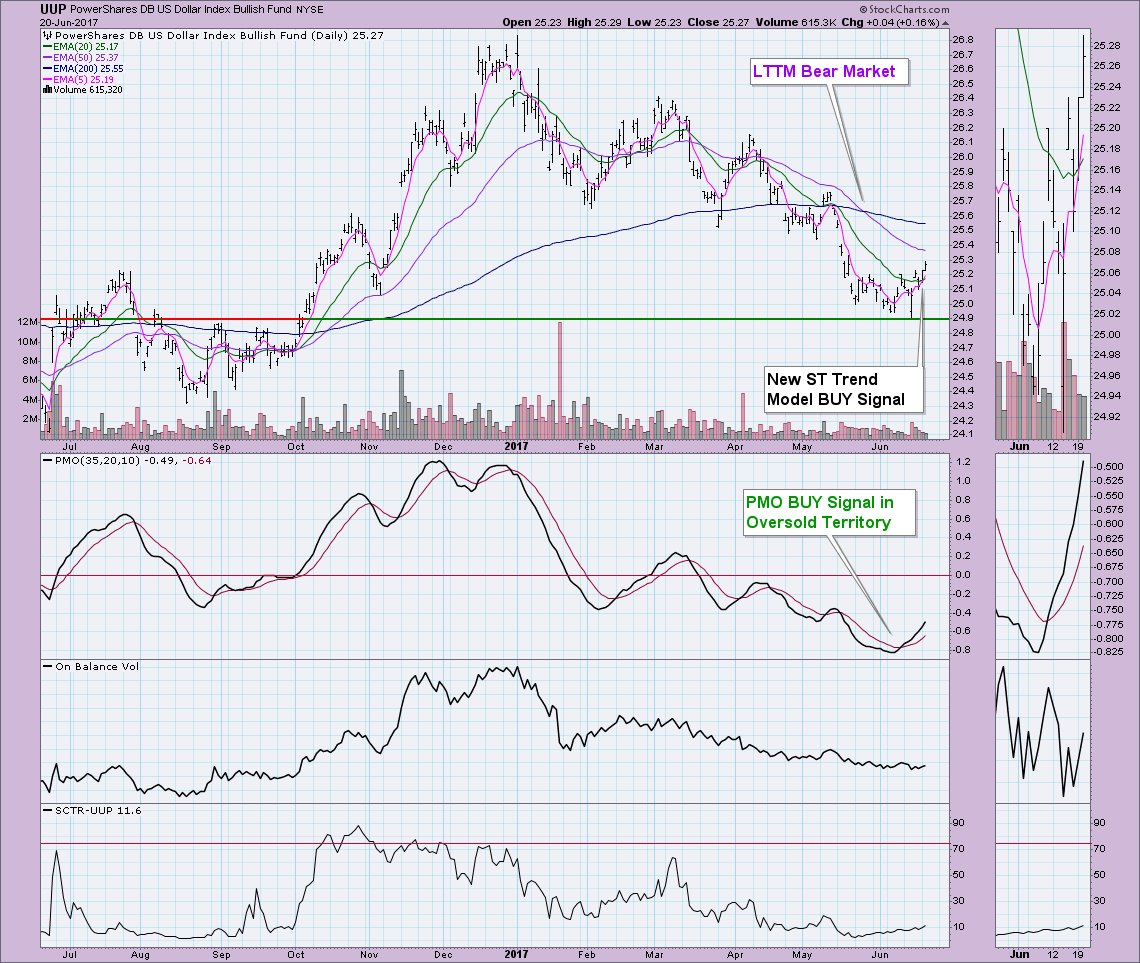
DOLLAR
IT Trend Model: NEUTRAL as of 3/21/2016
LT Trend Model: BUY as of 10/17/2016
The Dollar is mounting a comeback after bouncing successfully off support at $24.90. Today the 5-EMA crossed above the 20-EMA and triggered a ST Trend Model BUY signal. This is very encouraging since technically, UUP is in a bear market with the 50-EMA below the 200-EMA. The PMO is reacting perfectly and even the SCTR is angling upward a bit. The next area of overhead resistance $25.60 or near-term, the 50-EMA. Indicators are configured favorably, so I'm bullish on UUP.
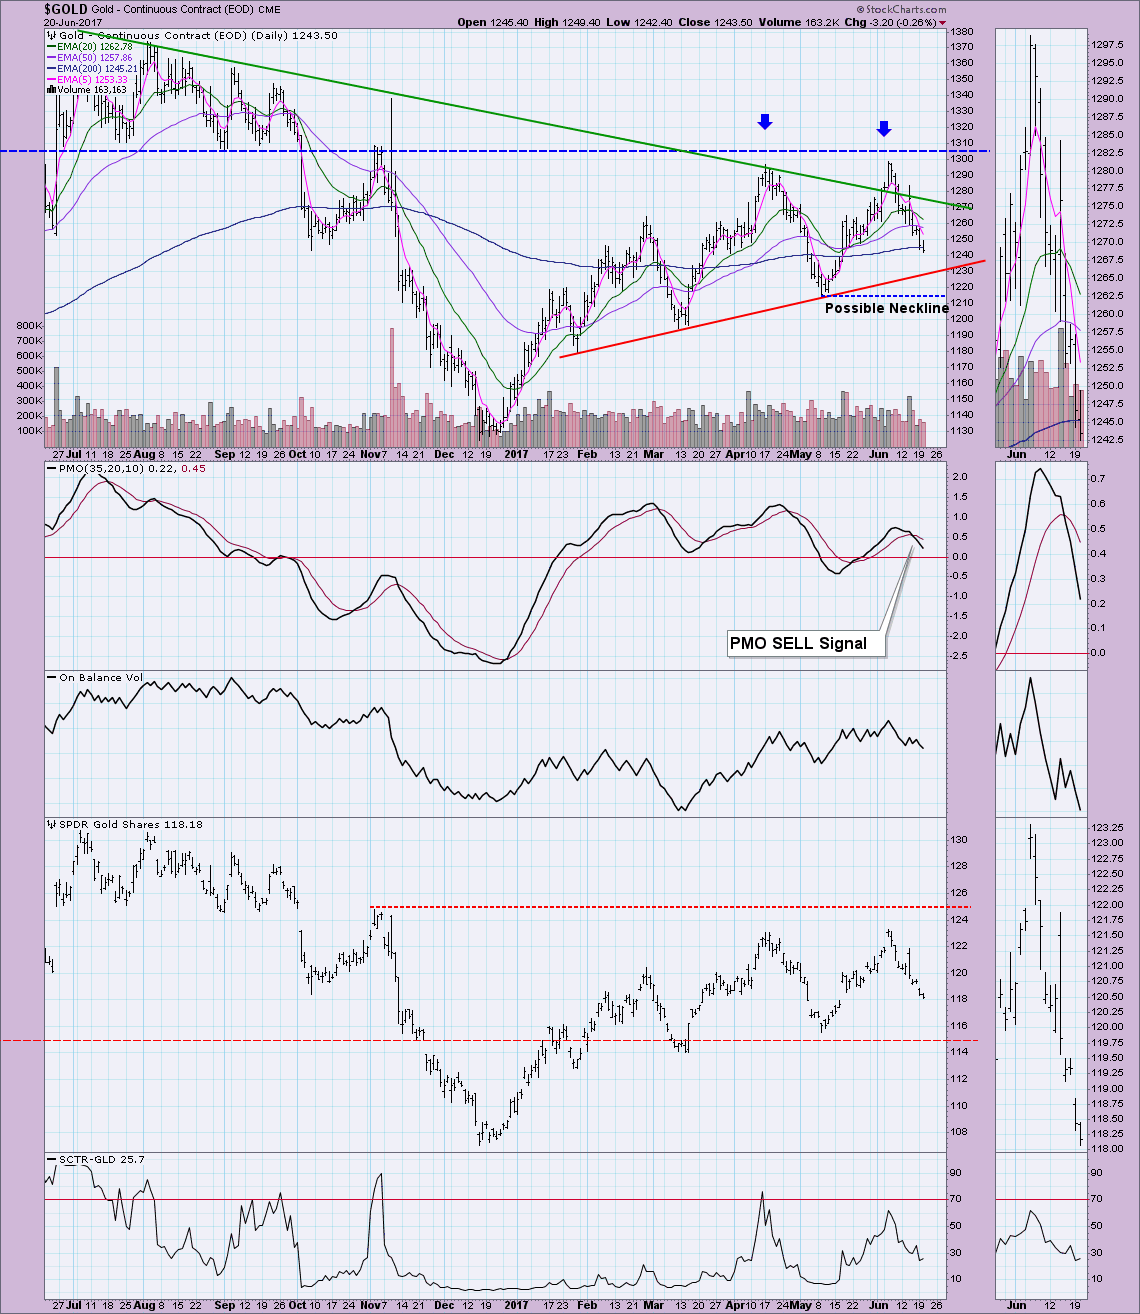
GOLD
IT Trend Model: BUY as of 5/22/2017
LT Trend Model: BUY as of 4/12/2017
As a consequence of the Dollar rallying, Gold is in full decline. I'm concerned we are looking at a large double-top with a neckline at $1215. If this is a double-top, the minimum downside target for the pattern would be $1120 or around the December low. Indicators are all negatively configured.
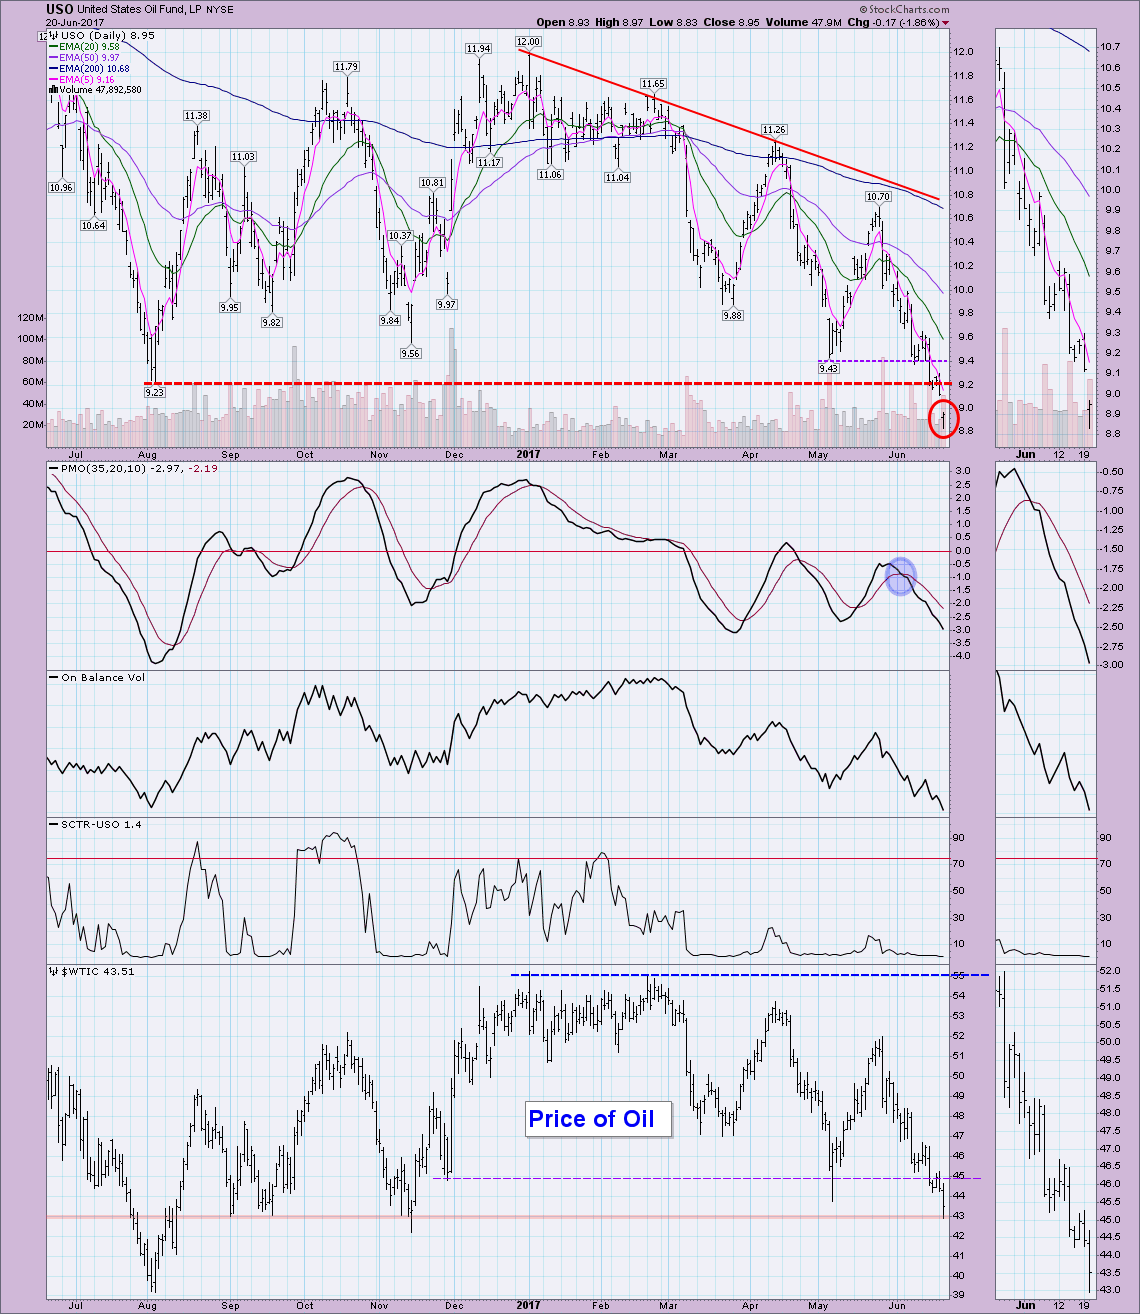
CRUDE OIL (USO)
IT Trend Model: NEUTRAL as of 3/8/2017
LT Trend Model: SELL as of 3/9/2017
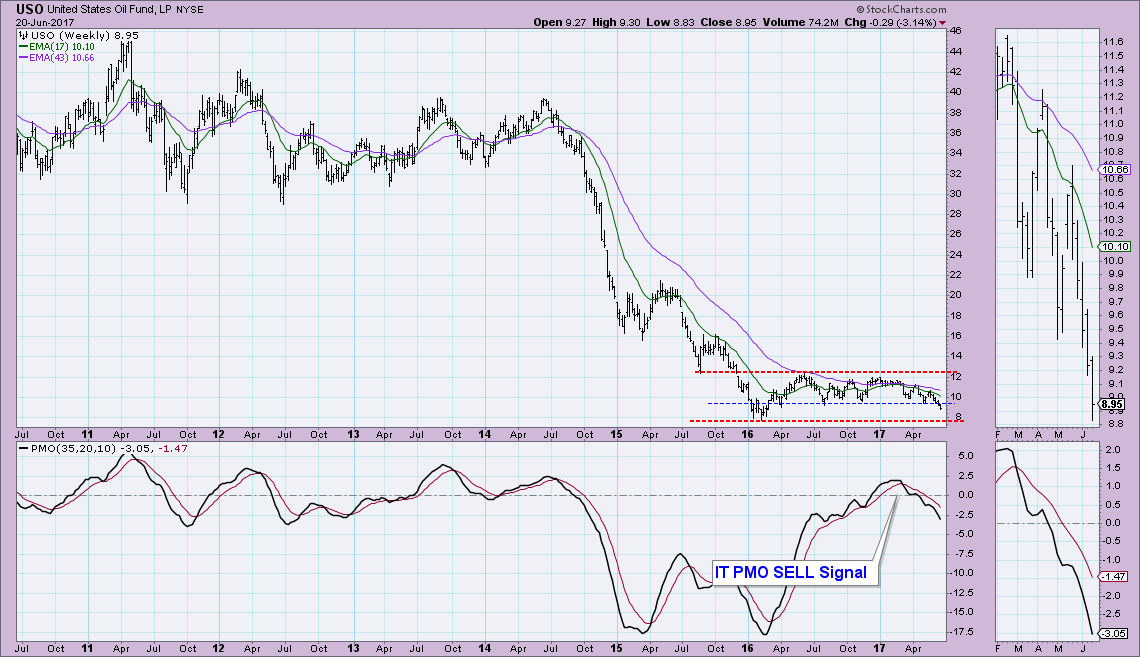
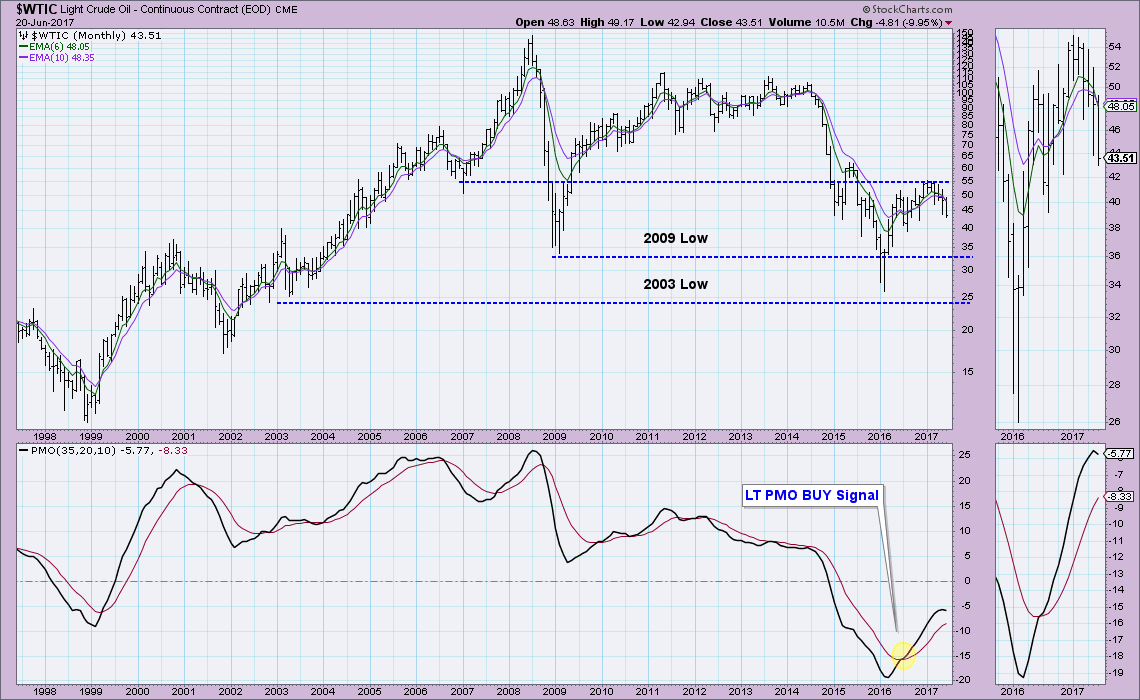
Today Oil crashed yet again, but is holding onto support at $43. USO broke down severely below support at $9.20. I suppose everyone is now asking if this is the bottom. I don't think so. Indicators remain very bearish and these prices are not as low as we've seen on USO. Looking at the weekly chart, you can see that strong support is just below $8.00! There's plenty of room for Oil to fall further as well when you look at the monthly chart for $WTIC. Just last year, we saw Oil prices near $25/barrel to $30/barrel. Don't count on this as a bottom.
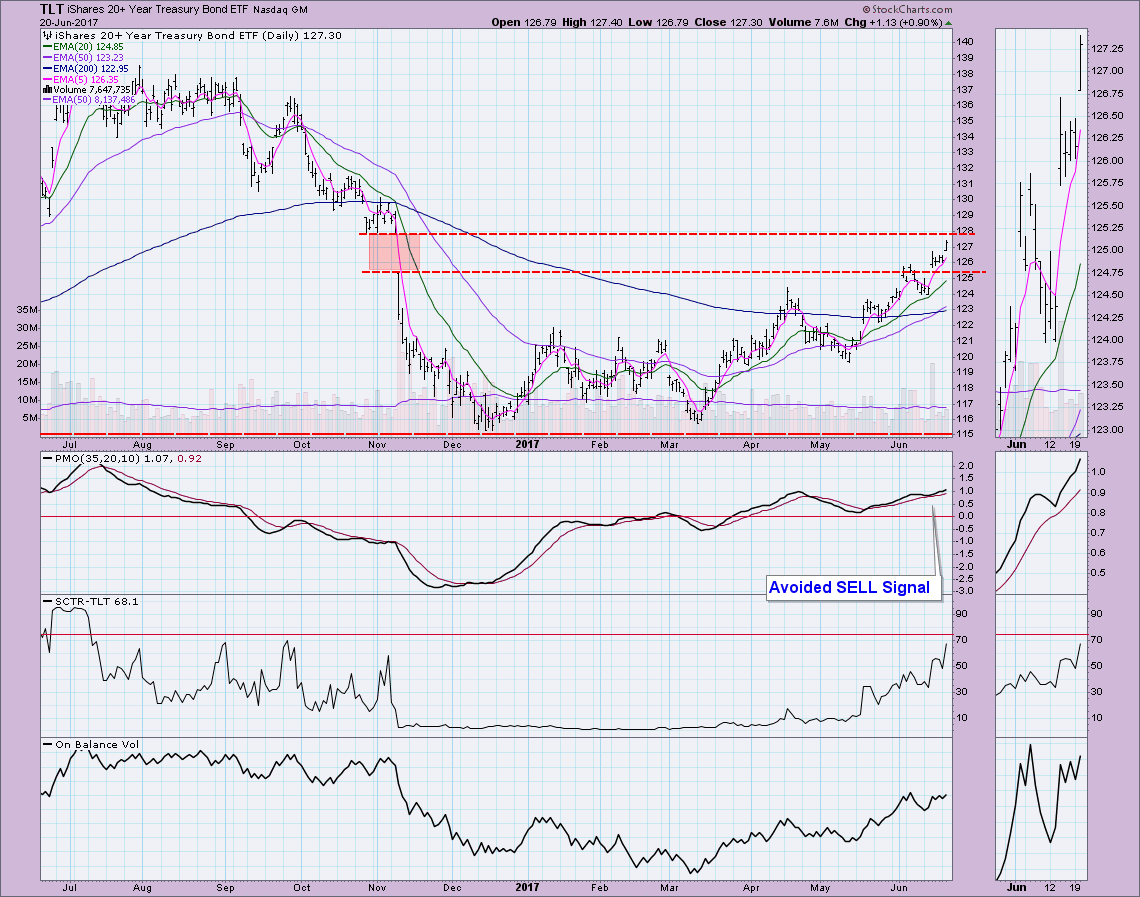
BONDS (TLT)
IT Trend Model: BUY as of 3/31/2017
LT Trend Model: BUY as of 6/16/2017
TLT is about to close the original gap down in November. The LT Trend Model just triggered a new BUY signal as the 50-EMA crossed above the 200-EMA. Indicators look pretty good with a PMO that avoided a previous SELL signal and a rising and very healthy SCTR. I like to see a bullish reflection in the OBV, but the last two OBV tops were in a negative divergence with price tops. A breakout above $128 should spur things on but a strong Dollar and rising interest rates could exert some gravity on price.
Helpful DecisionPoint Links:
DecisionPoint Shared ChartList and DecisionPoint Chart Gallery
Price Momentum Oscillator (PMO)
Swenlin Trading Oscillators (STO-B and STO-V)
Technical Analysis is a windsock, not a crystal ball.
Happy Charting!
- Erin
**Don't miss DecisionPoint Commentary! Add your email below to be notified of new updates"**