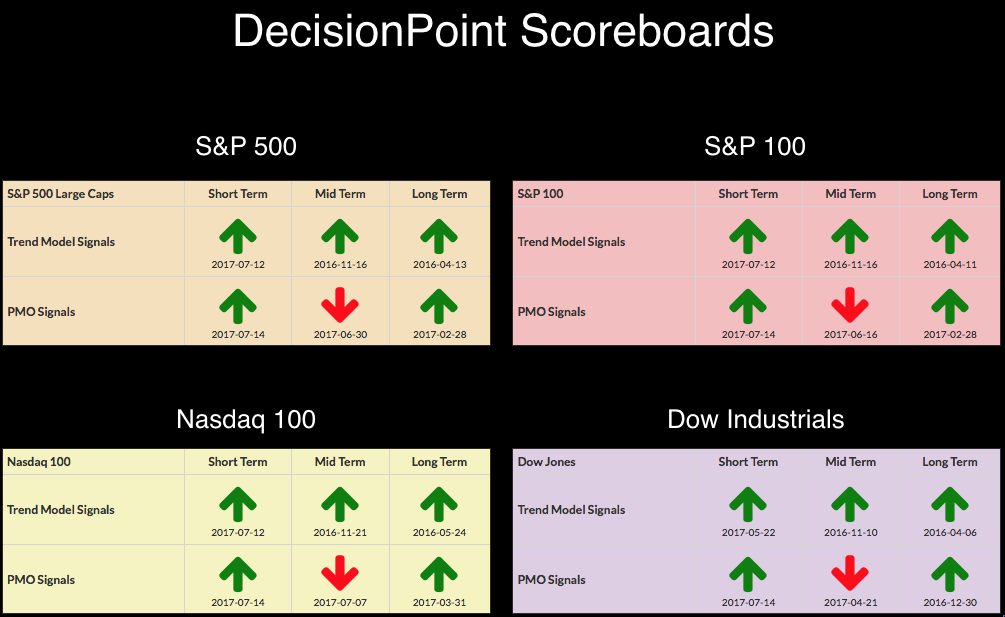
No new changes to report on the DecisionPoint Scoreboards, although if you didn't read about it last Friday, we did see FOUR new PMO BUY signals on all four indexes. The only "red" on the Scoreboards are on the IT PMO signals which are found on the weekly charts. You can take a look at all of the Scoreboard weekly charts annotated in the DecisionPoint ChartList.
The purpose of the DecisionPoint Alert Daily Update is to quickly review the day's action, internal condition, and Trend Model status of the broad market (S&P 500), the nine SPDR Sectors, the U.S. Dollar, Gold, Crude Oil, and Bonds. To ensure that using this daily reference will be quick and painless, we are as brief as possible, and sometimes we let a chart speak for itself.
SIGNALS: Here we include charts of any important signal changes triggered today by our Intermediate-Term Trend Model.
NO NEW SIGNALS TO REPORT.
NOTE: Mechanical trading model signals define the implied bias of the price index based upon moving average relationships, but they do not necessarily call for a specific action. They are information flags that should prompt chart review. Further, they do not call for continuous buying or selling during the life of the signal. For example, a BUY signal will probably return the best results if action is taken soon after the signal is generated. Additional opportunities for buying may be found as price zigzags higher, but the trader must look for optimum entry points. Conversely, exit points to preserve gains (or minimize losses) may be evident before the model mechanically closes the signal.
STOCKS
IT Trend Model: BUY as of 11/15/2016
LT Trend Model: BUY as of 4/1/2016
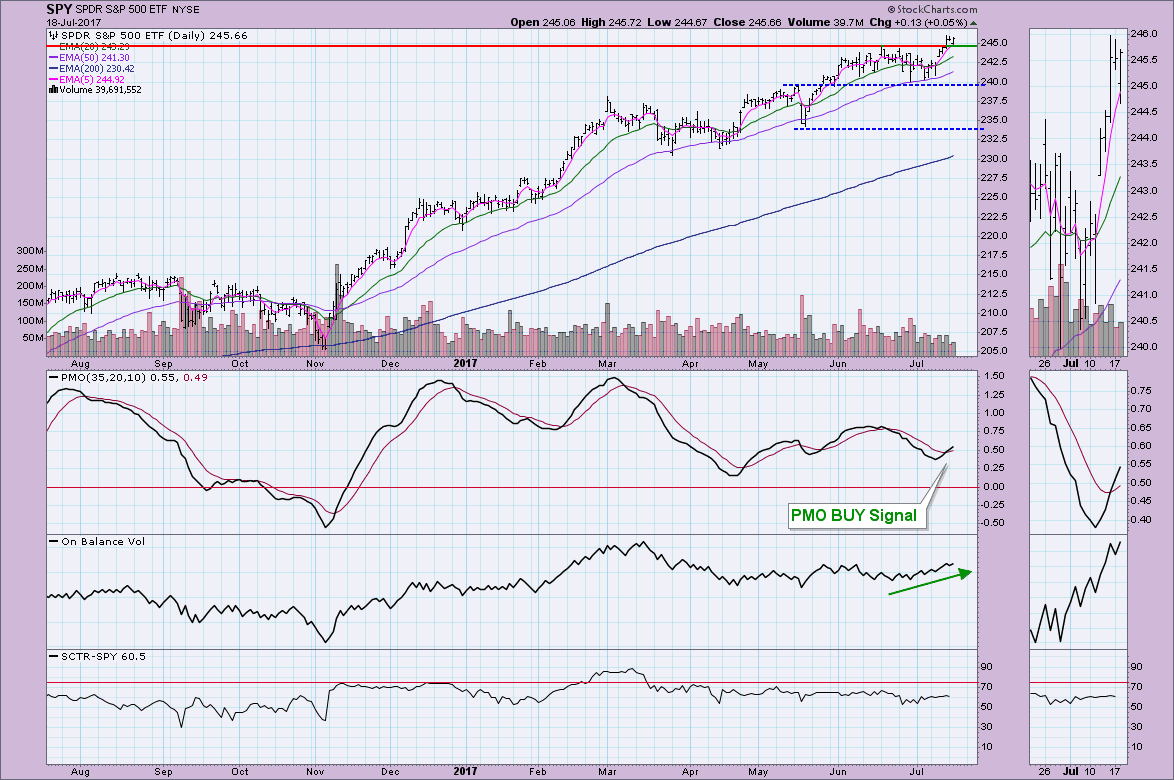
Price broke through previous all-time highs and established a new one at around $245 for the SPY.
So far that new support level is holding. As noted on the Scoreboards, we can see a new PMO BUY signal for the SPY that aligns with the SPX PMO BUY signal. The OBV is showing a bullish confirmation of the current rally.
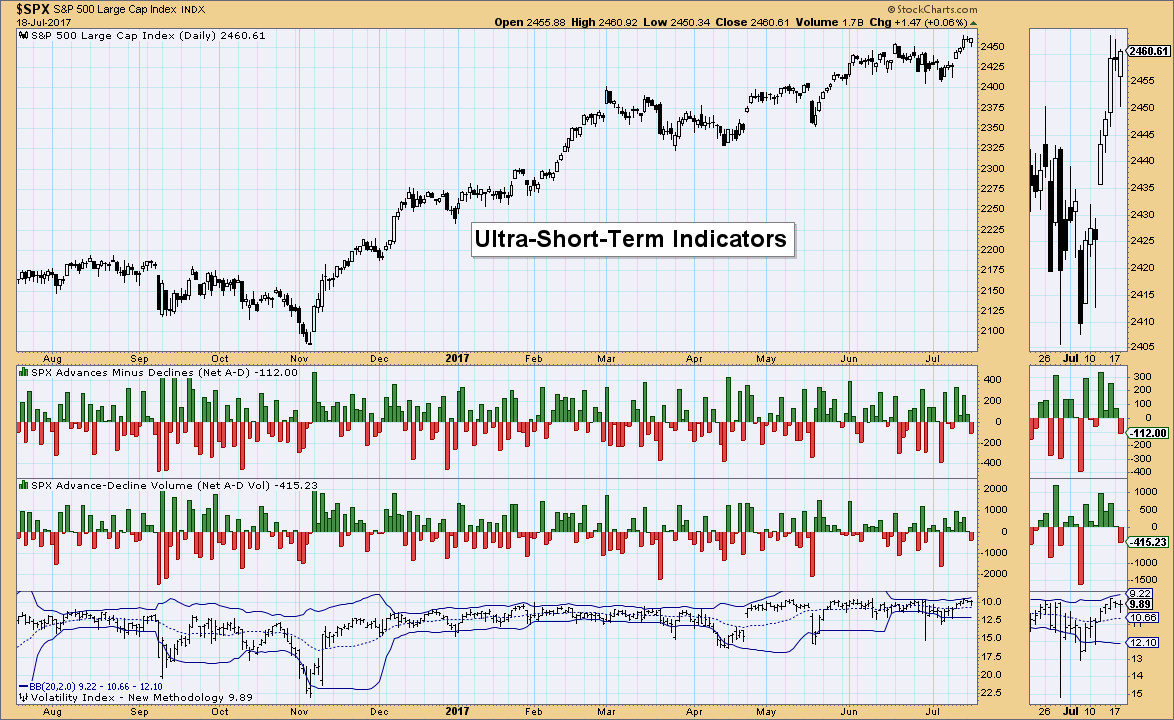
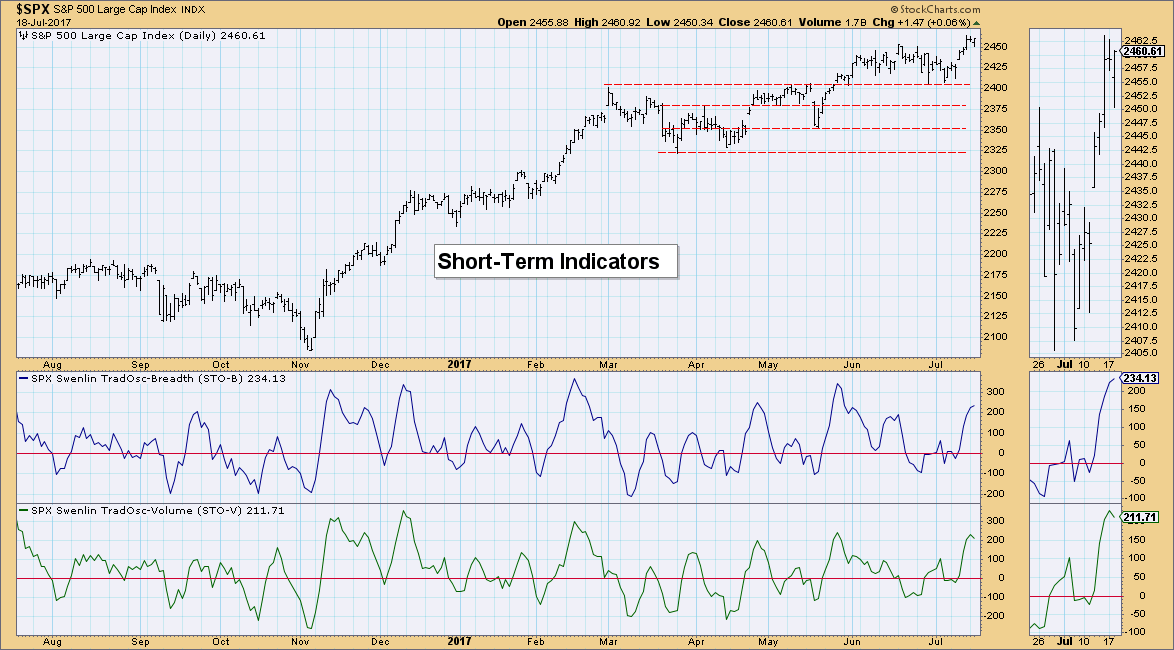
Ultra-Short-Term Indicators: We saw some elevated readings last week, but so far breadth is quiet this week. I like to see climactic readings and with the VIX in a compressed Bollinger Band and breadth not very one-sided and hence don't provide much information, at least right now.
Short-Term Indicators: I was actually somewhat surprised to see that our short-term indicators are beginning to turn over in somewhat overbought territory. This is bearish short term.
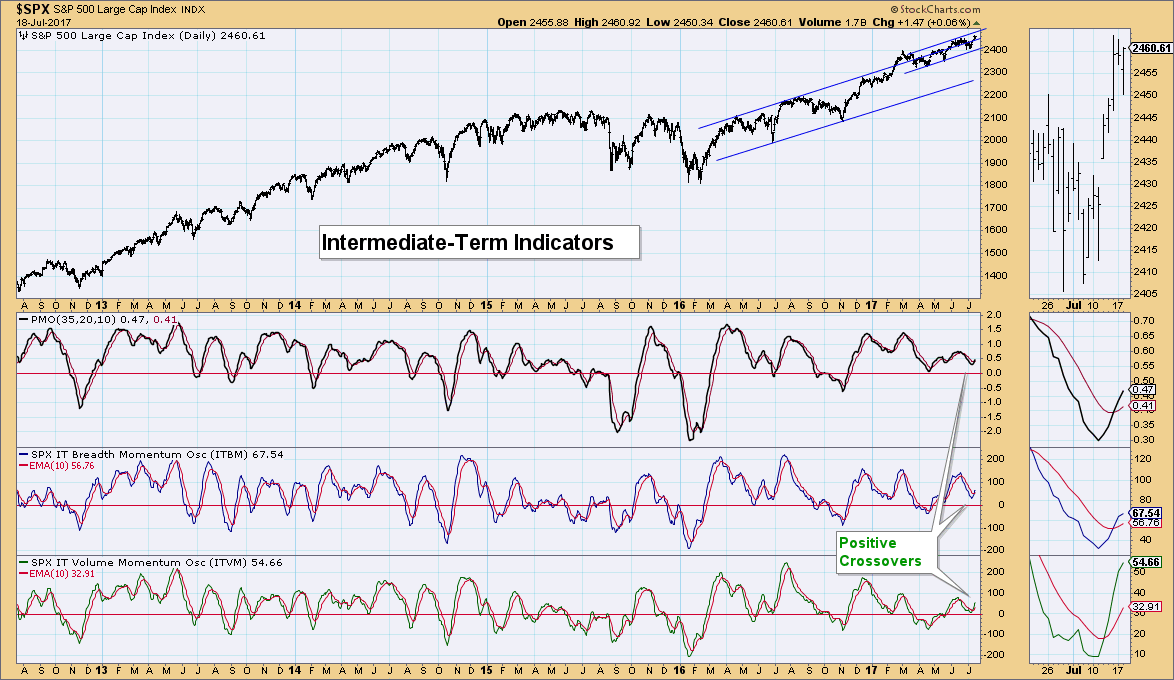
Intermediate-Term Indicators: On the other hand, intermediate-term indicators are looking pretty good. We've now seen a positive crossover for both (including the PMO) and it has happened above the zero line which is bullish.
Conclusion: The market has made new highs and seems to be holding above support at about $245. Short-term indicators are somewhat overbought and turning over. Yet, intermediate-term indicators are looking bullish. I suspect this means a pullback or consolidation in the short term, followed by a resumption of the rally based on the intermediate-term indicators.
DOLLAR
IT Trend Model: NEUTRAL as of 3/21/2016
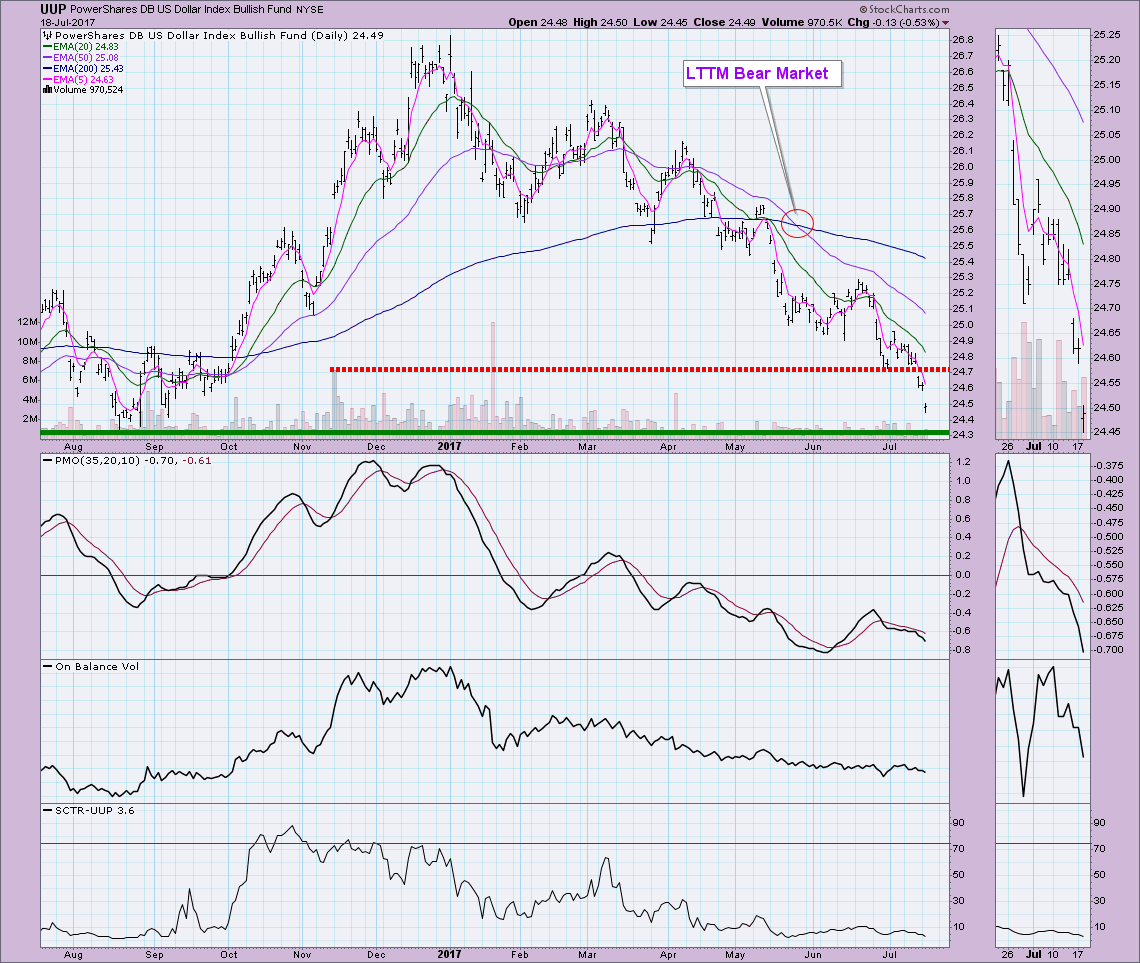
LT Trend Model: SELL as of 05/24/2017
I've been bearish on the Dollar for quite some time and I don't think it is yet time to get bullish. We are nearing support which could mean a bottom is arriving soon. However, the PMO is quite ugly and the OBV is showing a bearish confirmation right now. I think this is as good a place as we've seen in some time to provide support. When the PMO starts to turn, that will probably be the time to get into USO.
GOLD
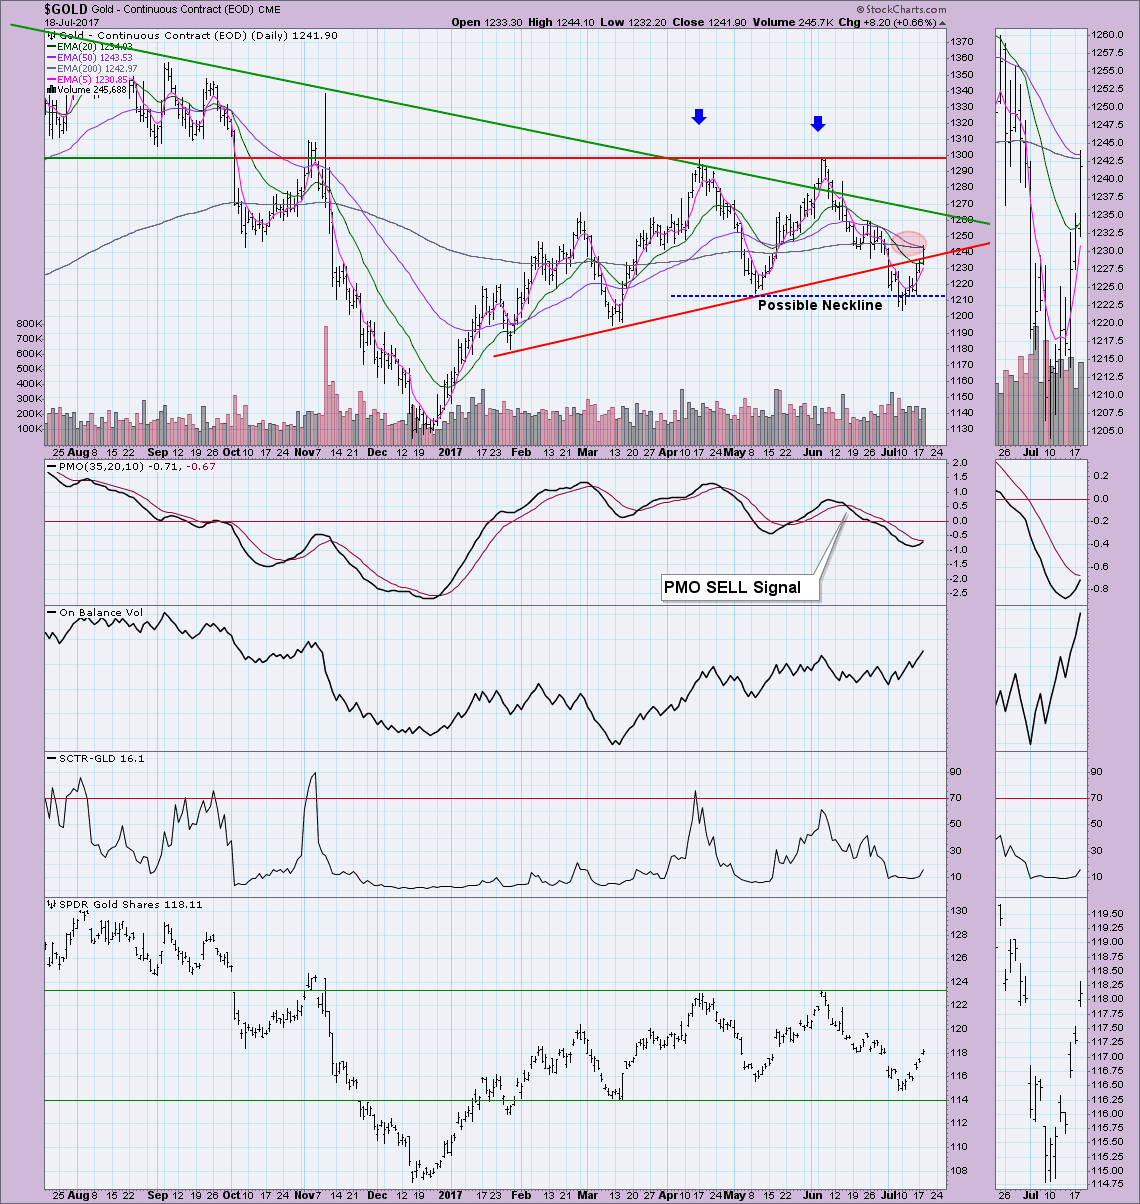
IT Trend Model: Neutral as of 6/29/2017
LT Trend Model: BUY as of 4/12/2017
Well, the declining tops trendline has been broken which suggest to me that the double-top formation has disintegrated. The PMO is about to claim a crossover BUY signal. I'm very impressed that the 50-EMA is avoiding a negative crossover with the 200-EMA. A negative crossover would imply that Gold is in a new bear market. By avoiding it, I can get more bullish on Gold. The OBV is confirming this current rally.
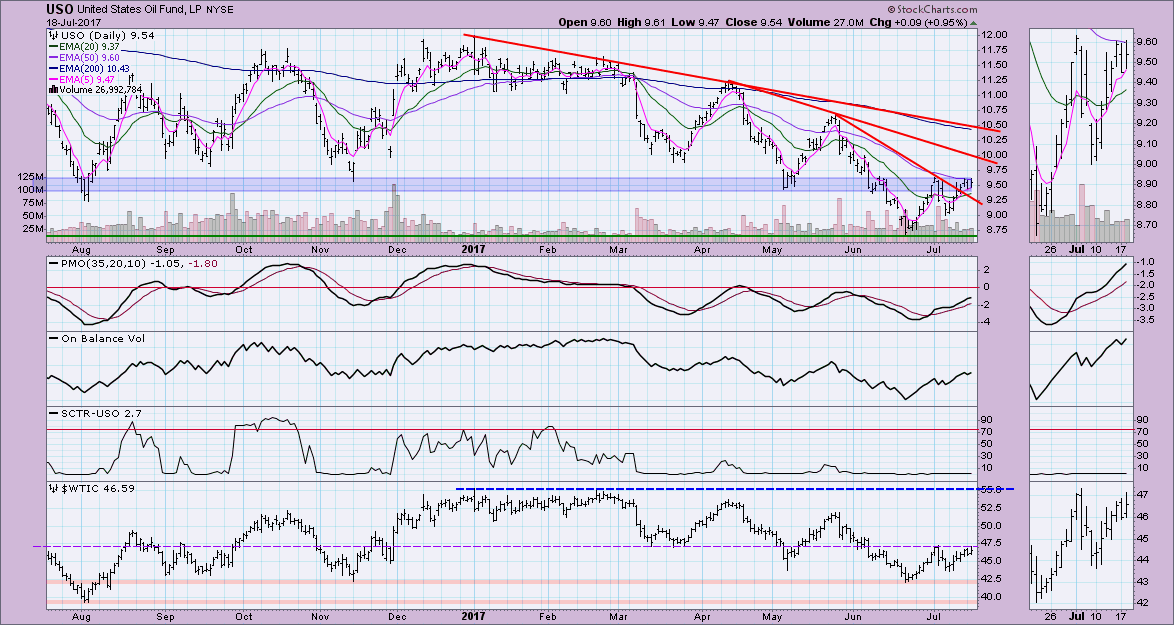
CRUDE OIL (USO)
IT Trend Model: NEUTRAL as of 3/8/2017
LT Trend Model: SELL as of 3/9/2017
Although the PMO and even the OBV look bullish, the failure of price to break above this area of resistance is a serious problem. Momentum has been positive since the rally off lows, but not much has come from the current PMO BUY signal. Oil is at the $47/barrel resistance level and I don't expect it to break above despite the PMO.
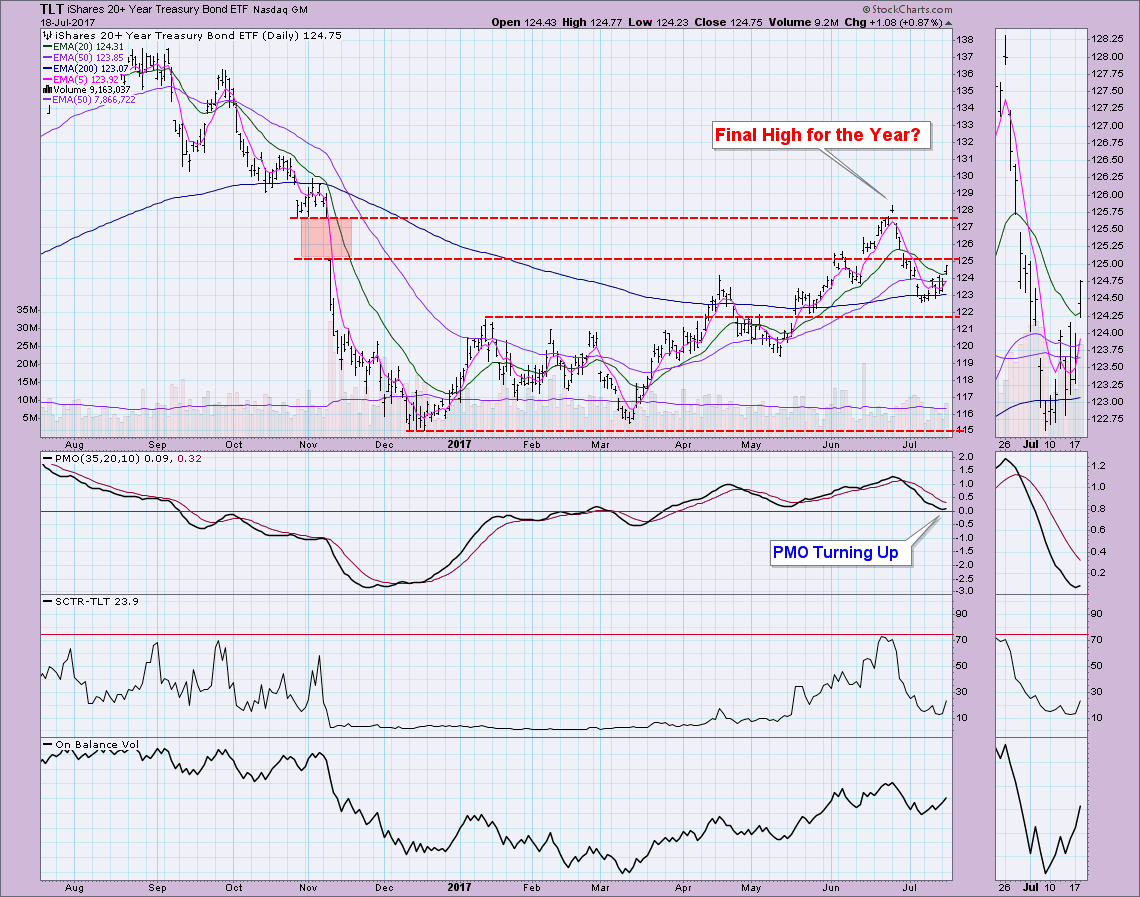
BONDS (TLT)
IT Trend Model: BUY as of 3/31/2017
LT Trend Model: BUY as of 6/16/2017
I can't help but see a small head and shoulders forming since mid-May. It would a messy one, but I think completely executable. That would put price squarely on support at $115. The PMO has turned up and the SCTR wants to come alive again, but I do not see TLT breaking above the $125 resistance area.
Helpful DecisionPoint Links:
DecisionPoint Shared ChartList and DecisionPoint Chart Gallery
Price Momentum Oscillator (PMO)
Swenlin Trading Oscillators (STO-B and STO-V)
Technical Analysis is a windsock, not a crystal ball.
Happy Charting!
- Erin
**Don't miss DecisionPoint Commentary! Add your email below to be notified of new updates"**