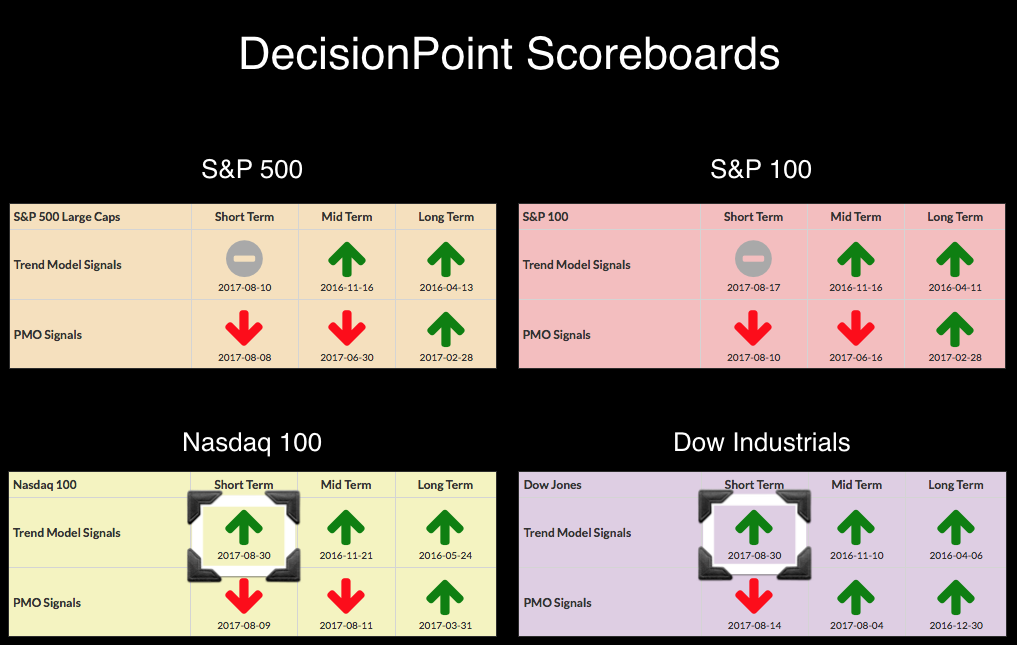
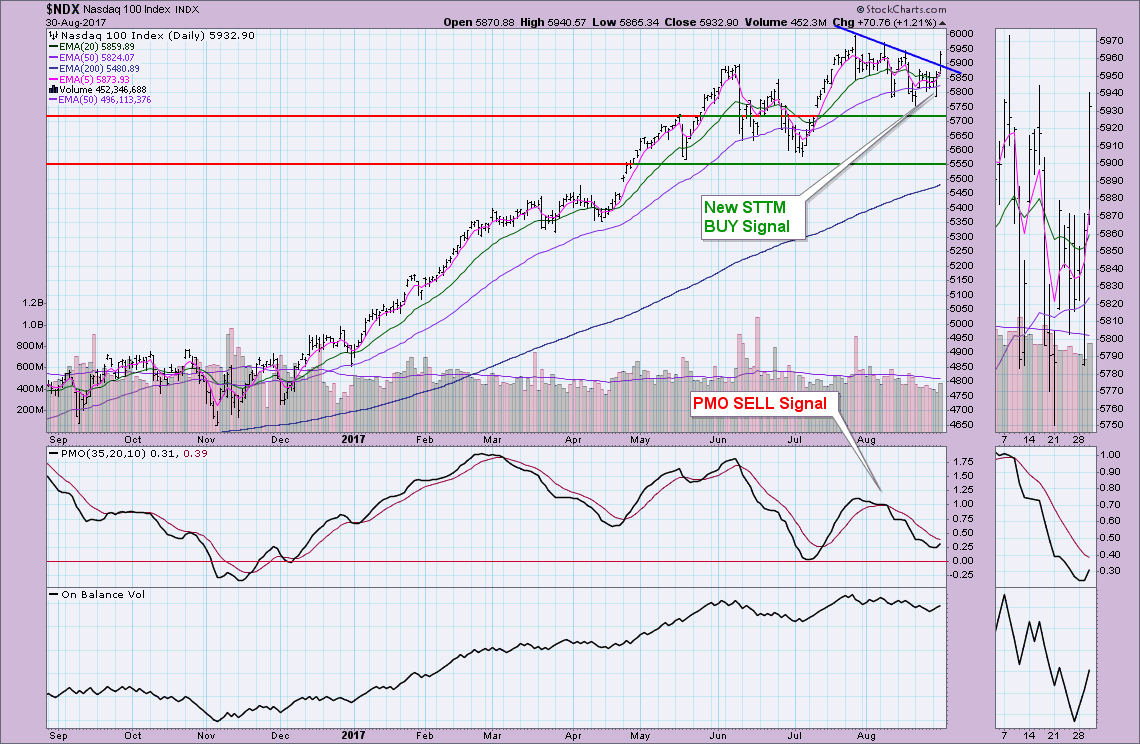
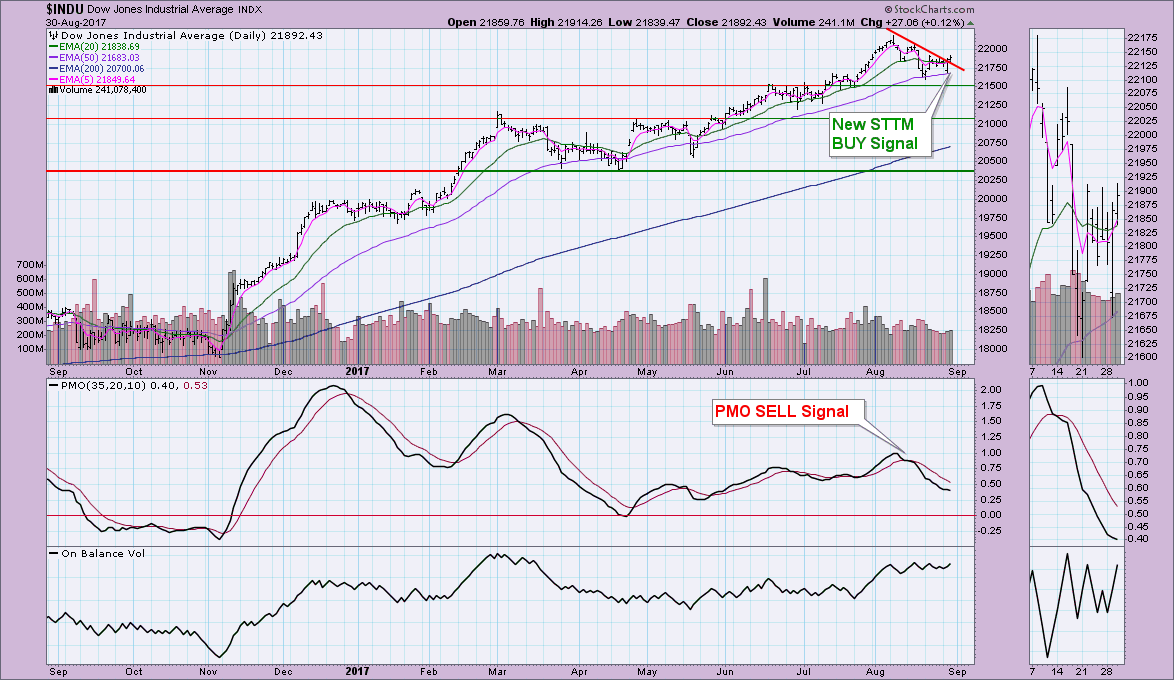
As you can see on the DecisionPoint Scoreboard summary, we had two new Short-Term Trend Model (STTM) BUY signals on the Dow and NDX. I've annotated the charts below the Scoreboards. Of particular note on those charts are the breakouts above the declining tops trendlines. The PMO on the NDX has now bottomed, but the Dow's PMO is still in a slow decline. The other big new signal was an Intermediate-Term Trend Model (ITTM) SELL signal on USO. Oil has been volatile but has been in a steady downtrend for quite some time. I'll go over that signal change in the section on Oil below.
The purpose of the DecisionPoint Alert Daily Update is to quickly review the day's action, internal condition, and Trend Model status of the broad market (S&P 500), the nine SPDR Sectors, the U.S. Dollar, Gold, Crude Oil, and Bonds. To ensure that using this daily reference will be quick and painless, we are as brief as possible, and sometimes we let a chart speak for itself.
SIGNALS: Here we include charts of any important signal changes triggered today by our Intermediate-Term Trend Model.
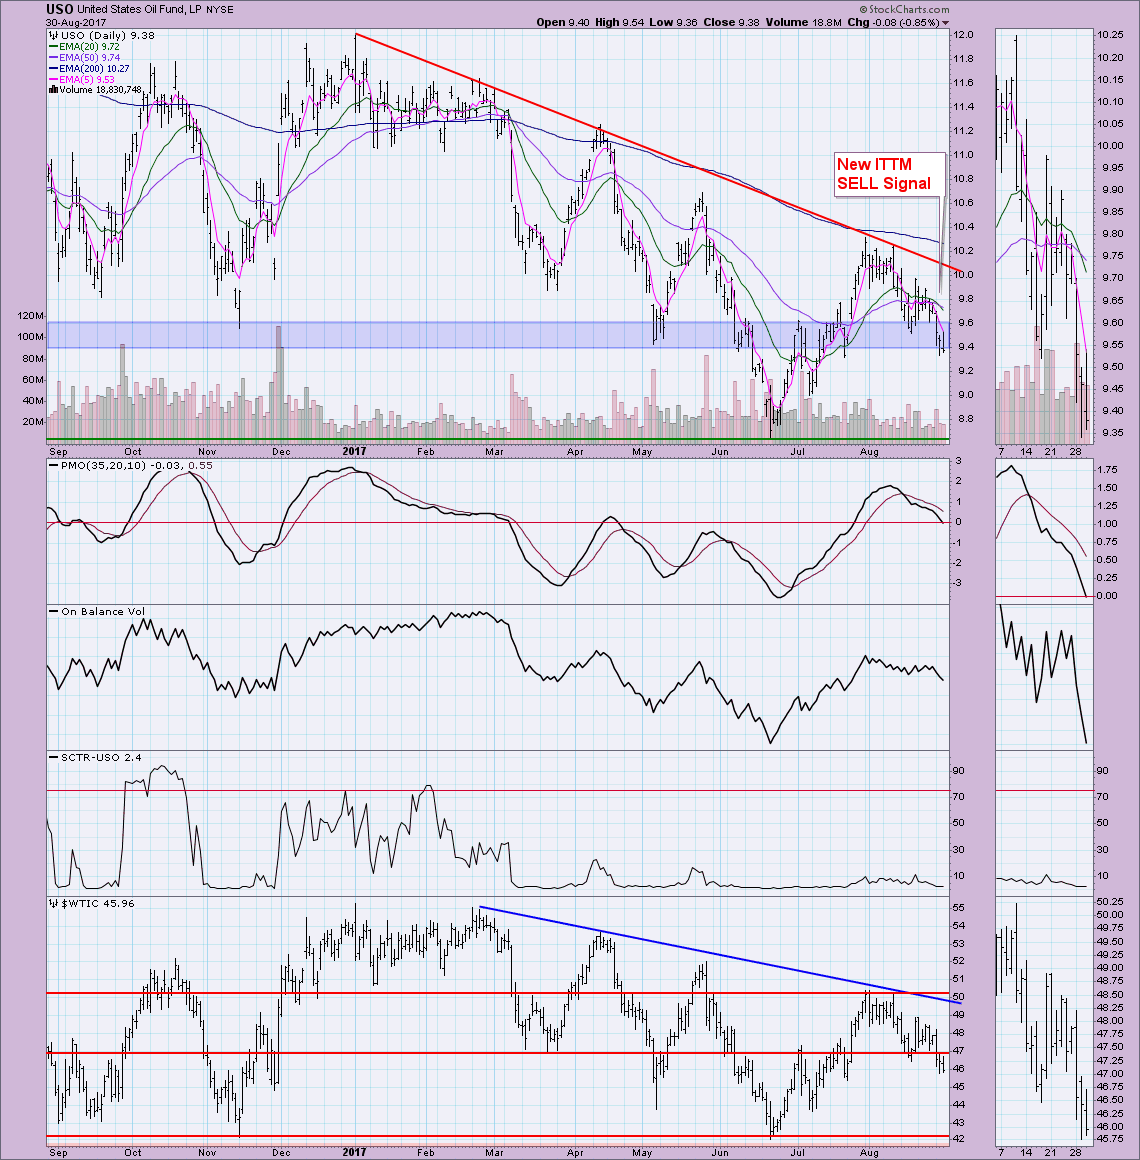
NEW ITTM SELL SIGNAL ON USO. I'll cover this in the section on Oil below.
NOTE: Mechanical trading model signals define the implied bias of the price index based upon moving average relationships, but they do not necessarily call for a specific action. They are information flags that should prompt chart review. Further, they do not call for continuous buying or selling during the life of the signal. For example, a BUY signal will probably return the best results if action is taken soon after the signal is generated. Additional opportunities for buying may be found as price zigzags higher, but the trader must look for optimum entry points. Conversely, exit points to preserve gains (or minimize losses) may be evident before the model mechanically closes the signal.
STOCKS
IT Trend Model: BUY as of 11/15/2016
LT Trend Model: BUY as of 4/1/2016
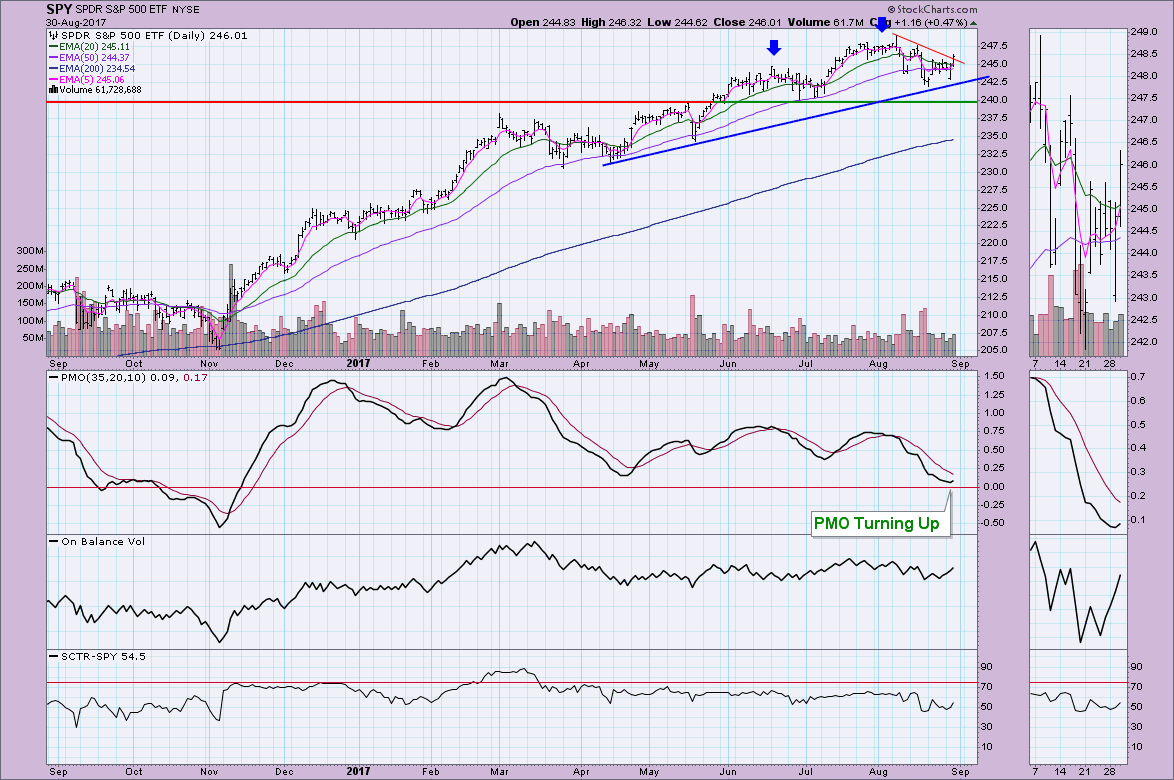
The breakout above the recent trading zone was encouraging. I'm not too concerned about the late day decline since price remained above new support.
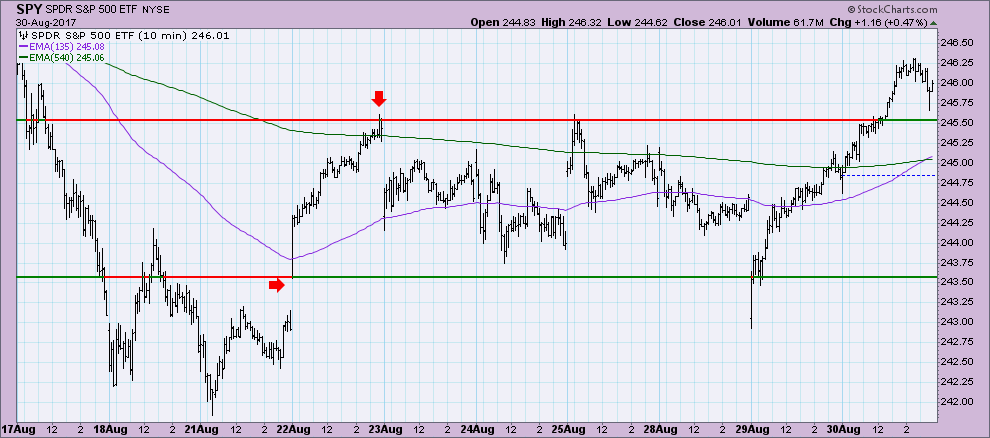
While the breakout above the declining tops line was not as pronounced on the SPY as it was on both the NDX and INDU, but the close above it was bullish. We should see a new STTM BUY signal on the SPX tomorrow. I like that the PMO has bottomed above the zero line, indicating internal strength.
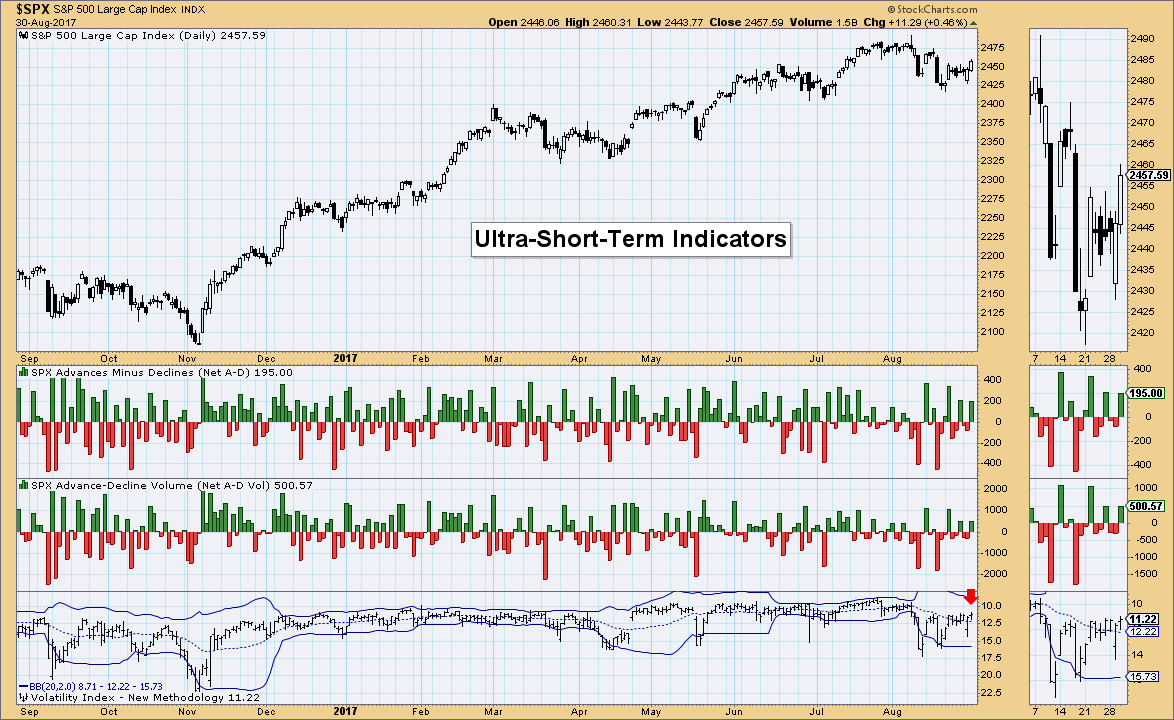
Ultra-Short-Term Indicators: Nothing much to report on the ultra-short-term indicators. While breadth readings were somewhat elevated to the upside, they weren't really climactic enough to make any conclusions. Add to that the VIX hovering along its centerline average and you have neutral readings across the board.
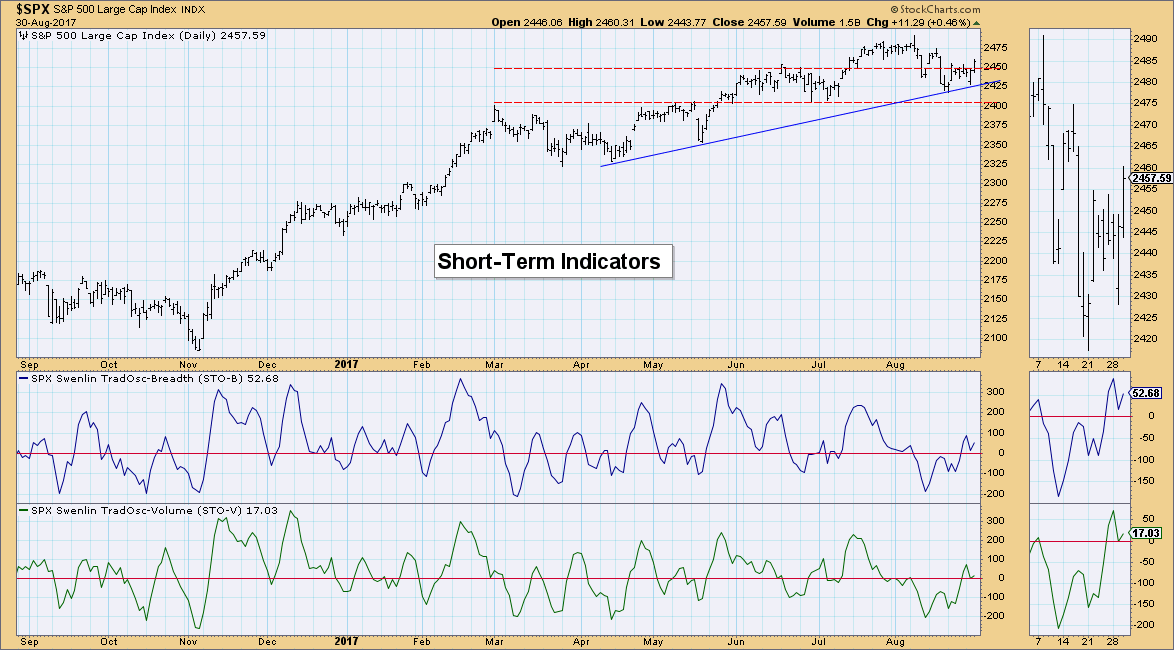
Short-Term Indicators: However, short-term indicators are beginning to perk up again above the zero line which is bullish short term. I like the bottoms above the zero line and the pronounced rising trend giving us a bullish confirmation of today's breakout. I read these charts as neutral this morning on the MarketWatchers LIVE show, but with these new readings, they lean bullish.
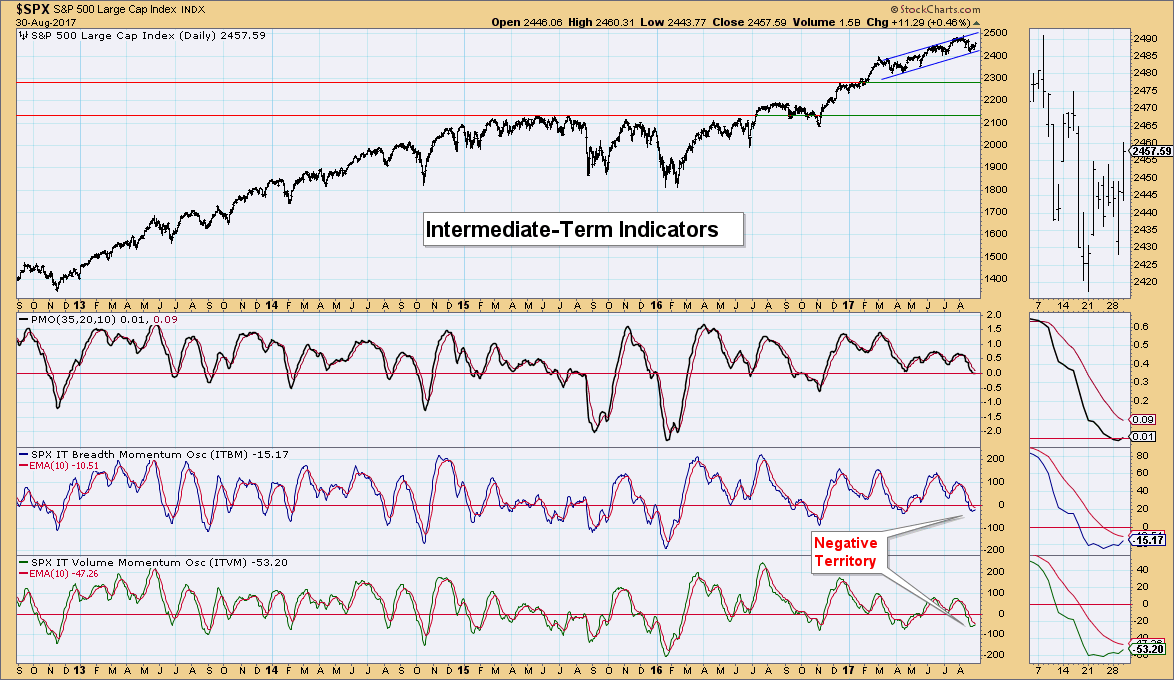
Intermediate-Term Indicators: I like that these indicators have bottomed in near-term oversold territory and are rising. I always hold back my excitement though as we should wait for positive crossovers to confirm. They are also leaning bullish.
Conclusion: Indicators are starting to look bullish and we now have a PMO bottom above the zero line on the SPY. The two new STTM BUY signals on the INDU and NDX, and the upcoming STTM BUY signal on the SPX, show that the bulls may finally be taking control. I suspect this breakout will hold. My main concern now is the possible head and shoulders pattern that could be forming on the SPY/SPX, but with indicators leaning bullish, I'm becoming less and less worried.
DOLLAR
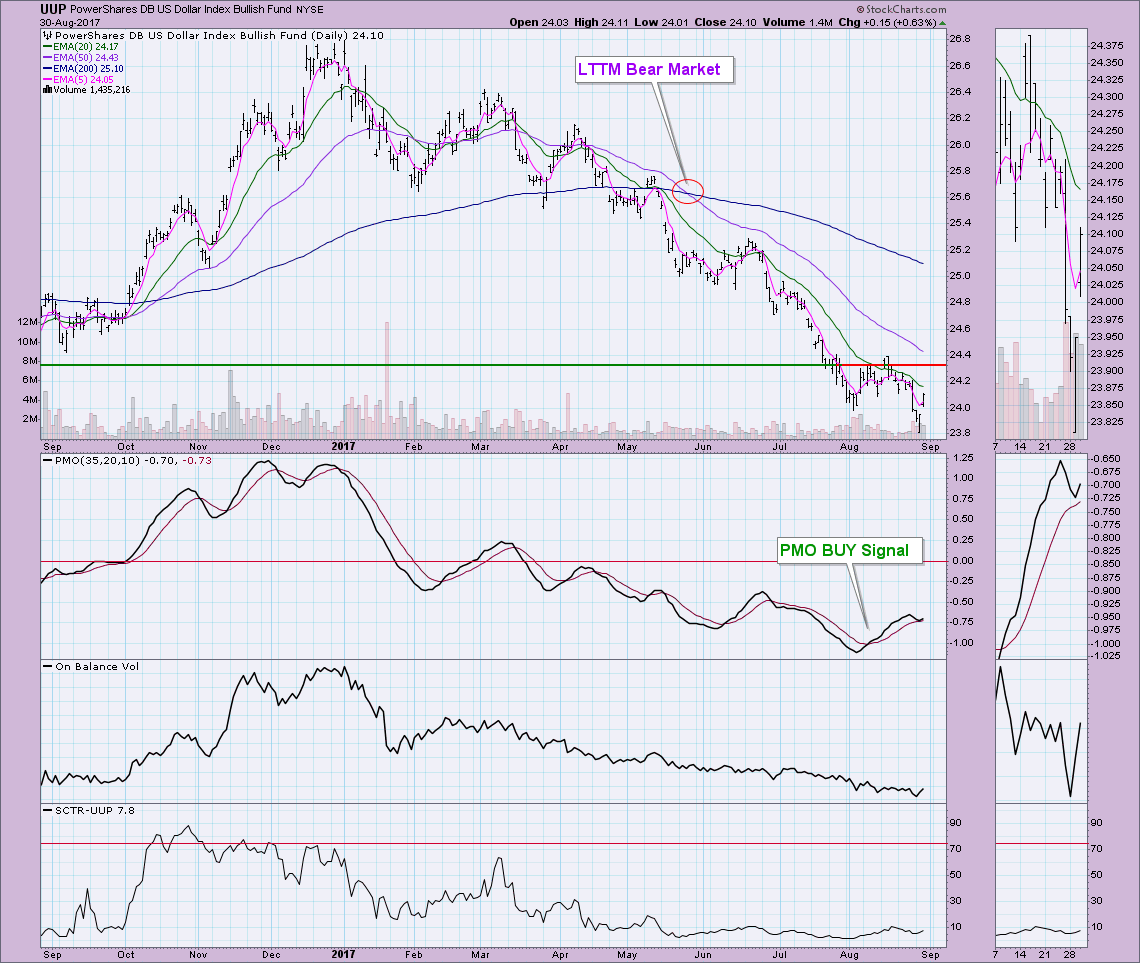
IT Trend Model: NEUTRAL as of 3/21/2016
LT Trend Model: SELL as of 05/24/2017
The Dollar bounced back with a gap up for UUP today. The pending PMO SELL signal was avoided as well. Overhead resistance at $24.40 could be a problem given that the OBV and SCTR don't look particularly healthy right now.
GOLD
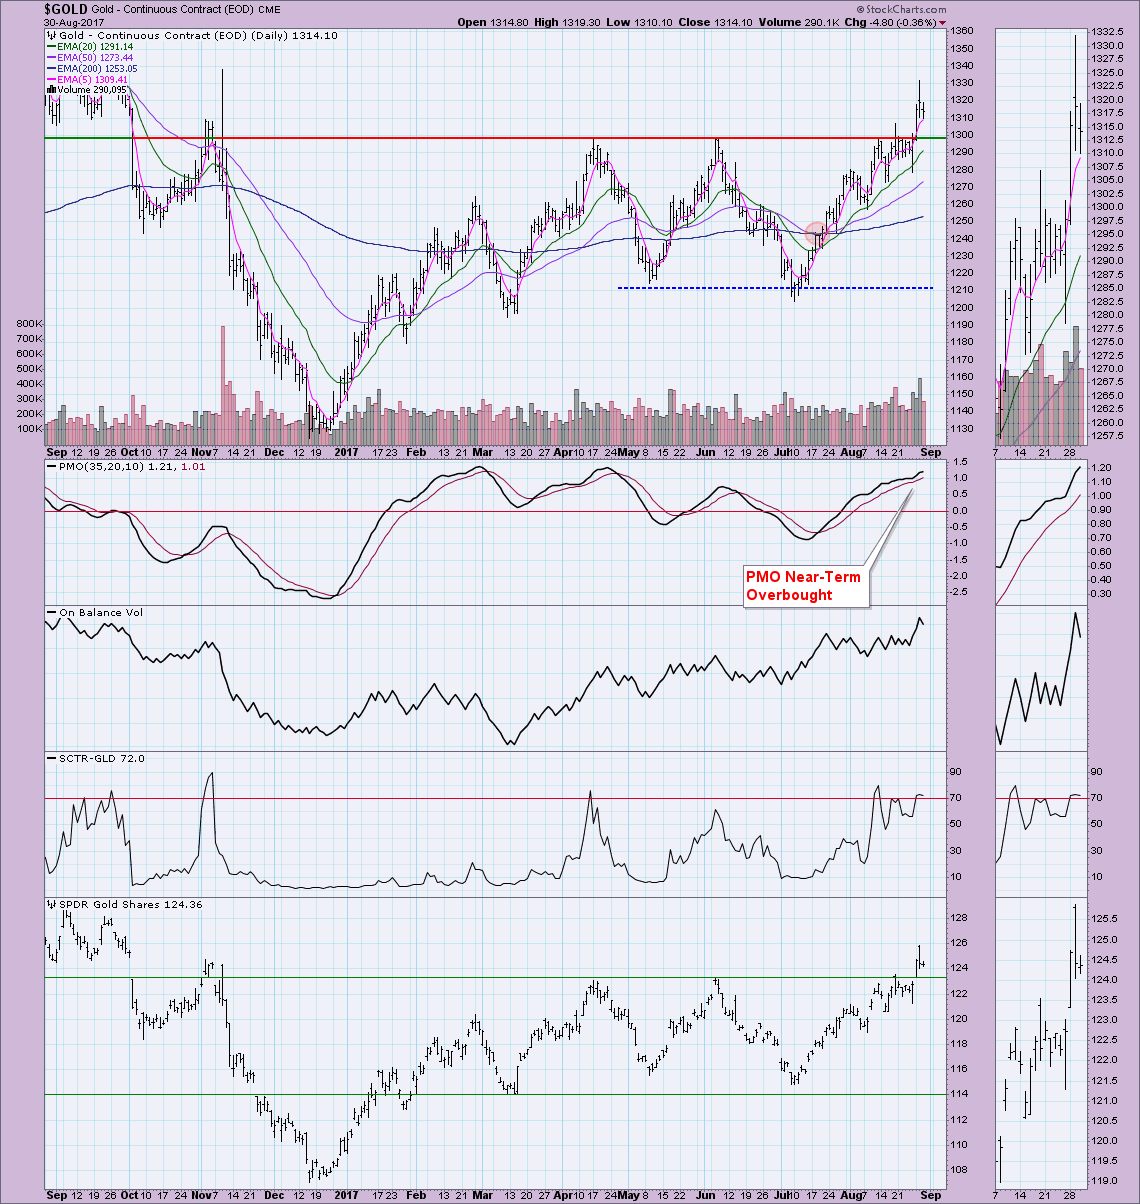
IT Trend Model: BUY as of 7/31/2017
LT Trend Model: BUY as of 4/12/2017
Tom and I have been beating Gold to death on the show, but for good reason. It has poised for a breakout above 1300 and both Tom and Erin were skeptical it would happen. Well, it did happen, in a big way. The breakout this week has been impressive. The PMO and OBV are confirming the move. The PMO may appear overbought, but a gander a long-term daily chart and you'll see that the normal range for Gold's PMO is between -2 and +2, so a reading of 1.21 isn't all that overbought in the grand scheme. The only concern I have now regarding Gold holding onto support at 1300 is the Dollar being set up for a longer-term rally and a bullish stock market. Typically a rising Dollar and rising market will suppress Gold.
CRUDE OIL (USO)
IT Trend Model: BUY as of 8/1/2017
LT Trend Model: SELL as of 3/9/2017
20/50-EMA negative crossovers are never good, but this one occurring so far below the 200-EMA tells me to run. The PMO is ugly, the OBV had been trending up slightly but is now decidedly moving lower. The SCTR is in the basement. If you look at the price of Oil per barrel, you can see that support at $47 was broken to the downside. The next area of solid support is at $42. That seems a likely stopping point for this decline.
BONDS (TLT)
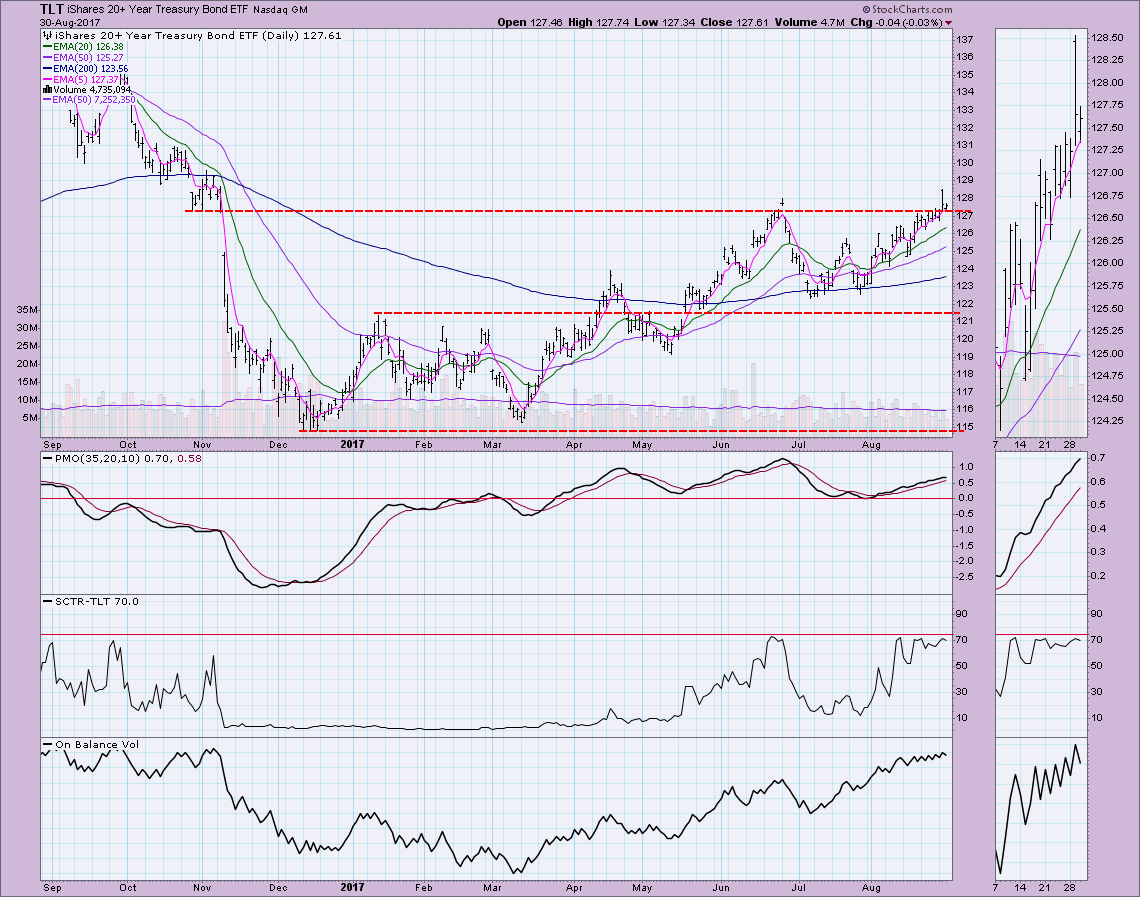
IT Trend Model: BUY as of 3/31/2017
LT Trend Model: BUY as of 6/16/2017
Bonds broke out yesterday and while they were down slightly today, support was held. We still need to see a close higher than the June top, but with a rising PMO, high SCTR value and upward trending OBV, it should hold onto this support level. However, Tom reviewed treasury yields today and remarked that they are beginning to rise and look ready to rise more. This would pull bond prices lower. For now, I'll rely on the very positive EMA configuration and strong indicators and call for support to be held here.
Helpful DecisionPoint Links:
DecisionPoint Shared ChartList and DecisionPoint Chart Gallery
Price Momentum Oscillator (PMO)
Swenlin Trading Oscillators (STO-B and STO-V)
Technical Analysis is a windsock, not a crystal ball.
Happy Charting!
- Erin
**Don't miss DecisionPoint Commentary! Add your email below to be notified of new updates"**